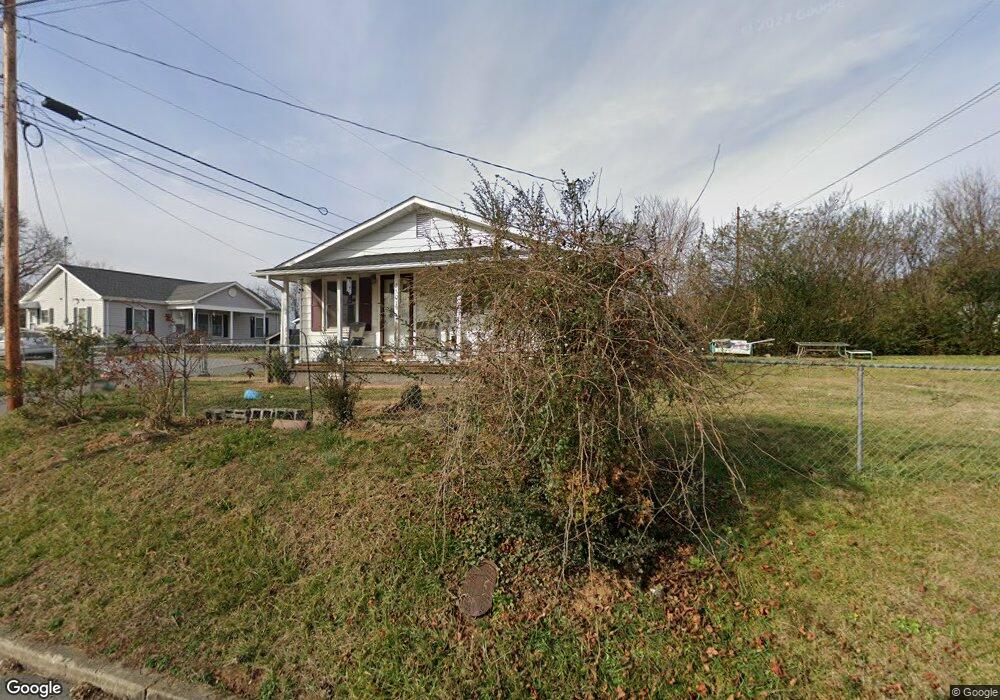
2501 Park Ave Johnson City, TN 37601
Estimated Value: $131,000 - $164,000
2
Beds
1
Bath
768
Sq Ft
$190/Sq Ft
Est. Value
About This Home
This home is located at 2501 Park Ave, Johnson City, TN 37601 and is currently estimated at $145,741, approximately $189 per square foot. 2501 Park Ave is a home located in Washington County with nearby schools including Fairmont Elementary School, Liberty Bell Middle School, and Indian Trail Middle School.
Ownership History
Date
Name
Owned For
Owner Type
Purchase Details
Closed on
Oct 29, 2015
Sold by
Hamilton Sallie Estate
Bought by
Hamilton Sheri
Current Estimated Value
Purchase Details
Closed on
Aug 11, 2005
Sold by
Claymon Angelia M
Bought by
Hamilton Sallie D
Home Financials for this Owner
Home Financials are based on the most recent Mortgage that was taken out on this home.
Original Mortgage
$50,400
Interest Rate
5.57%
Purchase Details
Closed on
Jul 9, 2001
Sold by
Peterson Nancy
Bought by
Claymon Angelia M
Home Financials for this Owner
Home Financials are based on the most recent Mortgage that was taken out on this home.
Original Mortgage
$45,600
Interest Rate
7.23%
Purchase Details
Closed on
Sep 22, 1997
Bought by
Renfro Ronnie and Renfro Linda
Create a Home Valuation Report for This Property
The Home Valuation Report is an in-depth analysis detailing your home's value as well as a comparison with similar homes in the area
Home Values in the Area
Average Home Value in this Area
Purchase History
| Date | Buyer | Sale Price | Title Company |
|---|---|---|---|
| Hamilton Sheri | -- | -- | |
| Hamilton Sallie D | $53,000 | -- | |
| Claymon Angelia M | $45,500 | -- | |
| Renfro Ronnie | $19,900 | -- |
Source: Public Records
Mortgage History
| Date | Status | Borrower | Loan Amount |
|---|---|---|---|
| Previous Owner | Renfro Ronnie | $50,400 | |
| Previous Owner | Renfro Ronnie | $45,600 |
Source: Public Records
Tax History Compared to Growth
Tax History
| Year | Tax Paid | Tax Assessment Tax Assessment Total Assessment is a certain percentage of the fair market value that is determined by local assessors to be the total taxable value of land and additions on the property. | Land | Improvement |
|---|---|---|---|---|
| 2024 | $569 | $33,300 | $9,350 | $23,950 |
| 2023 | $395 | $18,375 | $0 | $0 |
| 2022 | $395 | $18,375 | $4,950 | $13,425 |
| 2021 | $713 | $18,375 | $4,950 | $13,425 |
| 2020 | $709 | $18,375 | $4,950 | $13,425 |
| 2019 | $343 | $18,375 | $4,950 | $13,425 |
| 2018 | $616 | $14,425 | $3,300 | $11,125 |
| 2017 | $616 | $14,425 | $3,300 | $11,125 |
| 2016 | $613 | $14,425 | $3,300 | $11,125 |
| 2015 | $555 | $14,425 | $3,300 | $11,125 |
| 2014 | $519 | $14,425 | $3,300 | $11,125 |
Source: Public Records
Map
Nearby Homes
- 807 Long St
- 570 Sedgewick Way
- 1213 Glynridge St
- 2239 E Fairview Ave
- 1448 Piedmont St
- 1917 Club Dr
- 909 Pine Grove Ave
- 2107 E Watauga Ave
- 2112 E Watauga Ave
- 1620 Fairway Dr
- 126 Hughes St
- 2856 Watauga Rd
- 1808 E Myrtle Ave
- 604 Duke St
- 1510 E Chilhowie Ave
- 1605 E Myrtle Ave
- 1701 E Millard St
- 1314 Woodland Ave
- 1700 E Millard St
- 1607 E Millard St