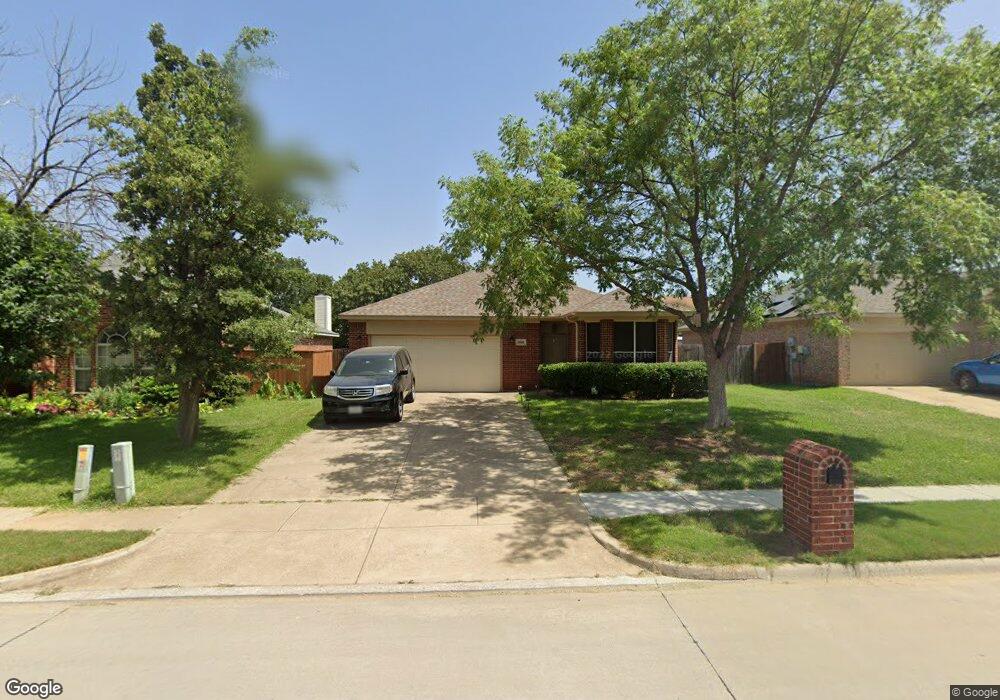
2501 Westheimer Rd Denton, TX 76210
South Denton NeighborhoodEstimated Value: $296,000 - $324,000
3
Beds
2
Baths
1,323
Sq Ft
$235/Sq Ft
Est. Value
About This Home
This home is located at 2501 Westheimer Rd, Denton, TX 76210 and is currently estimated at $311,510, approximately $235 per square foot. 2501 Westheimer Rd is a home located in Denton County with nearby schools including Nelson Elementary School, McMath Middle School, and Denton High School.
Ownership History
Date
Name
Owned For
Owner Type
Purchase Details
Closed on
May 5, 2011
Sold by
Boren James Stanley
Bought by
Montgomery Fredia L
Current Estimated Value
Home Financials for this Owner
Home Financials are based on the most recent Mortgage that was taken out on this home.
Original Mortgage
$112,084
Outstanding Balance
$76,868
Interest Rate
4.75%
Mortgage Type
FHA
Estimated Equity
$234,642
Purchase Details
Closed on
Feb 22, 2006
Sold by
Brown Timothy and Brown Danyel
Bought by
Baron Richard V
Purchase Details
Closed on
Sep 25, 2001
Sold by
Choice Homes Inc
Bought by
Brown Timothy
Home Financials for this Owner
Home Financials are based on the most recent Mortgage that was taken out on this home.
Original Mortgage
$117,700
Interest Rate
6.88%
Mortgage Type
FHA
Purchase Details
Closed on
Apr 19, 2001
Sold by
Harley Associates Ltd
Bought by
Choice Homes Inc
Create a Home Valuation Report for This Property
The Home Valuation Report is an in-depth analysis detailing your home's value as well as a comparison with similar homes in the area
Home Values in the Area
Average Home Value in this Area
Purchase History
| Date | Buyer | Sale Price | Title Company |
|---|---|---|---|
| Montgomery Fredia L | -- | None Available | |
| Baron Richard V | -- | None Available | |
| Brown Timothy | -- | -- | |
| Choice Homes Inc | -- | -- | |
| Choice Homes Inc | -- | -- |
Source: Public Records
Mortgage History
| Date | Status | Borrower | Loan Amount |
|---|---|---|---|
| Open | Montgomery Fredia L | $112,084 | |
| Previous Owner | Brown Timothy | $117,700 |
Source: Public Records
Tax History Compared to Growth
Tax History
| Year | Tax Paid | Tax Assessment Tax Assessment Total Assessment is a certain percentage of the fair market value that is determined by local assessors to be the total taxable value of land and additions on the property. | Land | Improvement |
|---|---|---|---|---|
| 2025 | $4,004 | $285,258 | $79,950 | $205,308 |
| 2024 | $5,200 | $269,390 | $0 | $0 |
| 2023 | $3,479 | $244,900 | $79,950 | $207,719 |
| 2022 | $4,726 | $222,636 | $63,038 | $159,803 |
| 2021 | $4,499 | $204,852 | $43,050 | $161,802 |
| 2020 | $4,206 | $183,996 | $43,050 | $140,946 |
| 2019 | $4,364 | $182,885 | $43,050 | $140,389 |
| 2018 | $4,016 | $166,259 | $43,050 | $123,209 |
| 2017 | $3,884 | $157,139 | $36,900 | $120,239 |
| 2016 | $3,379 | $144,718 | $36,900 | $110,034 |
| 2015 | $2,741 | $131,562 | $36,900 | $94,662 |
| 2014 | $2,741 | $120,149 | $36,900 | $86,456 |
| 2013 | -- | $109,226 | $36,900 | $72,326 |
Source: Public Records
Map
Nearby Homes
- 3900 Gessner Dr
- 2617 Bissonet Dr
- 2616 Hilcroft Ave
- 2713 Hilcroft Ave
- 2121 Corsair Ln
- 3812 Gennaker Dr
- 2617 Hollow Ridge Dr
- 3933 Parkhaven Dr
- 2804 Hollow Ridge Dr
- 2617 Hereford Rd
- 2817 Hereford Rd
- Pizarro Plan at
- Kingsley Plan at
- 4017 Whisperwood Rd
- Addison Plan at
- 2721 Arabian Ave
- 2601 Pinto Dr
- 3601 Monte Carlo Ln
- 2412 Miranda Place
- 2008 Moonsail Ln
- 2417 Westheimer Rd
- 2505 Westheimer Rd
- 2413 Westheimer Rd
- 2509 Westheimer Rd
- 2500 Briar Forest Dr
- 2420 Briar Forest Dr
- 2504 Briar Forest Dr
- 2416 Briar Forest Dr
- 2409 Westheimer Rd
- 2416 Westheimer Rd
- 2508 Briar Forest Dr
- 2504 Westheimer Rd
- 2513 Westheimer Rd
- 2412 Briar Forest Dr
- 2412 Westheimer Rd
- 2508 Westheimer Rd
- 2512 Briar Forest Dr
- 2517 Westheimer Rd
- 2405 Westheimer Rd
- 2408 Westheimer Rd