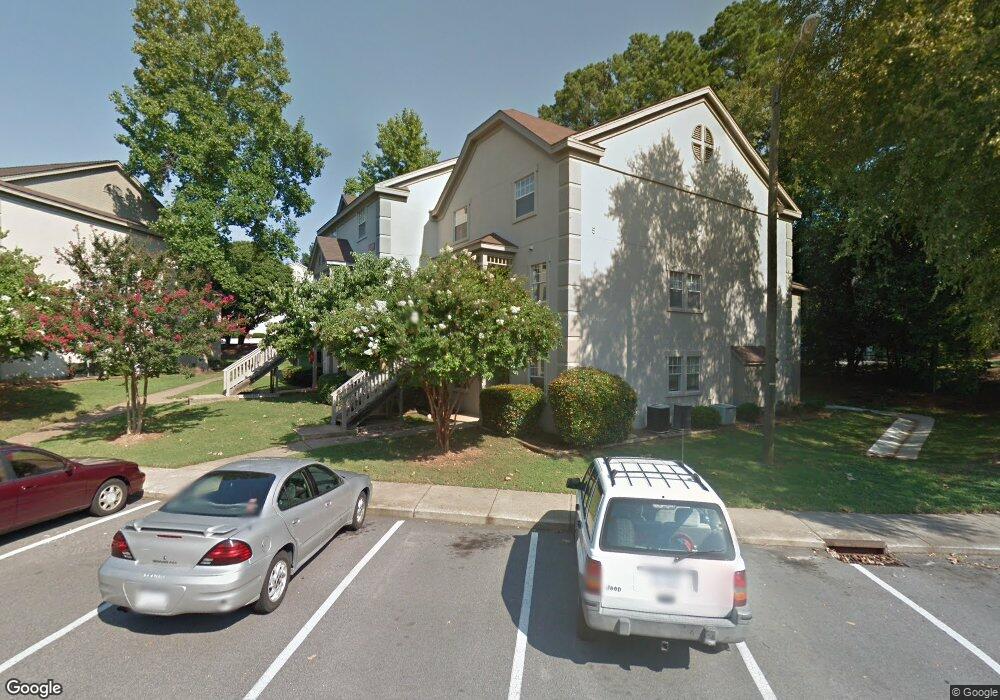
2502 Avent Ferry Rd Unit 40C Raleigh, NC 27606
Estimated Value: $231,689 - $341,000
--
Bed
2
Baths
1,156
Sq Ft
$226/Sq Ft
Est. Value
About This Home
This home is located at 2502 Avent Ferry Rd Unit 40C, Raleigh, NC 27606 and is currently estimated at $261,672, approximately $226 per square foot. 2502 Avent Ferry Rd Unit 40C is a home located in Wake County with nearby schools including Weatherstone Elementary School, Davis Drive Middle, and Atlas International School.
Ownership History
Date
Name
Owned For
Owner Type
Purchase Details
Closed on
Mar 3, 2005
Sold by
Farag Charles and Farag Susan
Bought by
Farag David
Current Estimated Value
Home Financials for this Owner
Home Financials are based on the most recent Mortgage that was taken out on this home.
Original Mortgage
$64,000
Outstanding Balance
$32,446
Interest Rate
5.61%
Mortgage Type
Fannie Mae Freddie Mac
Estimated Equity
$229,226
Purchase Details
Closed on
Aug 15, 2003
Sold by
Newkirk Michael R and Newkirk Marcia J
Bought by
Steed Adam Antonio
Purchase Details
Closed on
Jun 22, 1998
Sold by
Fogle Fred A
Bought by
Newkirk Michael R and Newkirk Marcia J
Home Financials for this Owner
Home Financials are based on the most recent Mortgage that was taken out on this home.
Original Mortgage
$43,050
Interest Rate
7.5%
Create a Home Valuation Report for This Property
The Home Valuation Report is an in-depth analysis detailing your home's value as well as a comparison with similar homes in the area
Home Values in the Area
Average Home Value in this Area
Purchase History
| Date | Buyer | Sale Price | Title Company |
|---|---|---|---|
| Farag David | -- | -- | |
| Steed Adam Antonio | $66,000 | -- | |
| Newkirk Michael R | $61,500 | -- |
Source: Public Records
Mortgage History
| Date | Status | Borrower | Loan Amount |
|---|---|---|---|
| Open | Farag David | $64,000 | |
| Previous Owner | Newkirk Michael R | $43,050 |
Source: Public Records
Tax History Compared to Growth
Tax History
| Year | Tax Paid | Tax Assessment Tax Assessment Total Assessment is a certain percentage of the fair market value that is determined by local assessors to be the total taxable value of land and additions on the property. | Land | Improvement |
|---|---|---|---|---|
| 2025 | $1,907 | $216,333 | -- | $216,333 |
| 2024 | $1,899 | $216,333 | $0 | $216,333 |
| 2023 | $1,530 | $138,528 | $0 | $138,528 |
| 2022 | $1,423 | $138,528 | $0 | $138,528 |
| 2021 | $1,368 | $138,528 | $0 | $138,528 |
| 2020 | $1,343 | $138,528 | $0 | $138,528 |
| 2019 | $1,022 | $86,495 | $0 | $86,495 |
| 2018 | $965 | $86,495 | $0 | $86,495 |
| 2017 | $920 | $86,495 | $0 | $86,495 |
| 2016 | $901 | $86,495 | $0 | $86,495 |
| 2015 | $824 | $77,660 | $0 | $77,660 |
| 2014 | $782 | $77,660 | $0 | $77,660 |
Source: Public Records
Map
Nearby Homes
- 2441 Campus Shore Dr Unit 109
- 2316 Champion Ct
- 4242 Kaplan Dr
- 4258 Kaplan Dr
- 2440 Campus Shore Dr Unit 103
- 4350 Hunters Club Dr
- 519 Brent Rd
- 1956 Gorman St
- 4025 Greenleaf St
- 709 Brent Rd
- 1334 Kent Rd
- 1006 Carlton Ave
- 1312 Onslow Rd
- 4609 Kaplan Dr
- 713 Valerie Dr
- 1208 Lorimer Rd
- 3418 Avent Ferry Rd
- 820 Nuttree Place
- 4100 Reavis Rd
- 0 Crump Rd
- 2500 Avent Ferry Rd Unit 28B
- 2502 Avent Ferry Rd Unit 201
- 2502 Avent Ferry Rd Unit 202
- 2502 Avent Ferry Rd Unit 102
- 2502 Avent Ferry Rd Unit 203
- 2502 Avent Ferry Rd Unit 204
- 2502 Avent Ferry Rd Unit 103
- 2502 Avent Ferry Rd Unit 205
- 2502 Avent Ferry Rd Unit 206
- 2504 Avent Ferry Rd Unit 101
- 2504 Avent Ferry Rd Unit 201
- 2504 Avent Ferry Rd Unit 202
- 2504 Avent Ferry Rd Unit 102
- 2504 Avent Ferry Rd Unit 203
- 2504 Avent Ferry Rd Unit 204
- 2504 Avent Ferry Rd Unit 103
- 2504 Avent Ferry Rd Unit 205
- 2504 Avent Ferry Rd Unit 206
- 2506 Avent Ferry Rd Unit 101
- 2506 Avent Ferry Rd Unit 201