2502 E 28th St Vancouver, WA 98661
Rose Village NeighborhoodEstimated Value: $394,000 - $456,000
3
Beds
2
Baths
1,632
Sq Ft
$259/Sq Ft
Est. Value
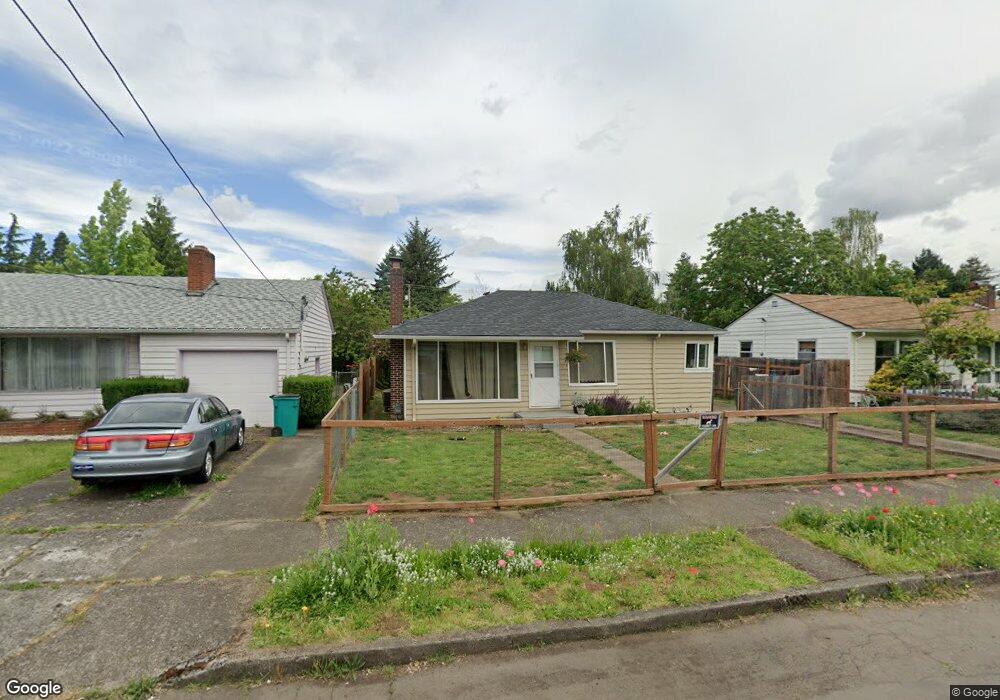
About This Home
This home is located at 2502 E 28th St, Vancouver, WA 98661 and is currently estimated at $422,713, approximately $259 per square foot. 2502 E 28th St is a home located in Clark County with nearby schools including Harney Elementary School, Discovery Middle School, and Hudson's Bay High School.
Ownership History
Date
Name
Owned For
Owner Type
Purchase Details
Closed on
Apr 30, 2014
Sold by
Federal Home Loan Mortgage Corporation
Bought by
Page Alissa
Current Estimated Value
Home Financials for this Owner
Home Financials are based on the most recent Mortgage that was taken out on this home.
Original Mortgage
$153,122
Outstanding Balance
$116,478
Interest Rate
4.28%
Mortgage Type
VA
Estimated Equity
$306,235
Purchase Details
Closed on
Dec 27, 2013
Sold by
Minton Janet L
Bought by
Federal Home Loan Mortgage Corporation
Purchase Details
Closed on
Sep 29, 1997
Sold by
Brewer Douglas G and Brewer Mary M
Bought by
Minton Janet L
Home Financials for this Owner
Home Financials are based on the most recent Mortgage that was taken out on this home.
Original Mortgage
$109,356
Interest Rate
7.33%
Mortgage Type
FHA
Create a Home Valuation Report for This Property
The Home Valuation Report is an in-depth analysis detailing your home's value as well as a comparison with similar homes in the area
Home Values in the Area
Average Home Value in this Area
Purchase History
| Date | Buyer | Sale Price | Title Company |
|---|---|---|---|
| Page Alissa | -- | Clark County Title Co | |
| Federal Home Loan Mortgage Corporation | $154,557 | Clark County Title Co | |
| Minton Janet L | $110,000 | First American Title Co |
Source: Public Records
Mortgage History
| Date | Status | Borrower | Loan Amount |
|---|---|---|---|
| Open | Page Alissa | $153,122 | |
| Previous Owner | Minton Janet L | $109,356 |
Source: Public Records
Tax History Compared to Growth
Tax History
| Year | Tax Paid | Tax Assessment Tax Assessment Total Assessment is a certain percentage of the fair market value that is determined by local assessors to be the total taxable value of land and additions on the property. | Land | Improvement |
|---|---|---|---|---|
| 2025 | $4,207 | $410,087 | $162,000 | $248,087 |
| 2024 | $3,781 | $430,668 | $162,000 | $268,668 |
| 2023 | $3,695 | $404,078 | $160,650 | $243,428 |
| 2022 | $3,431 | $396,436 | $156,600 | $239,836 |
| 2021 | $3,394 | $342,971 | $135,000 | $207,971 |
| 2020 | $3,078 | $319,787 | $122,151 | $197,636 |
| 2019 | $2,769 | $300,477 | $107,851 | $192,626 |
| 2018 | $2,873 | $280,018 | $0 | $0 |
| 2017 | $2,373 | $241,166 | $0 | $0 |
| 2016 | $2,228 | $207,862 | $0 | $0 |
| 2015 | $2,136 | $186,490 | $0 | $0 |
| 2014 | -- | $169,061 | $0 | $0 |
| 2013 | -- | $145,509 | $0 | $0 |
Source: Public Records
Map
Nearby Homes