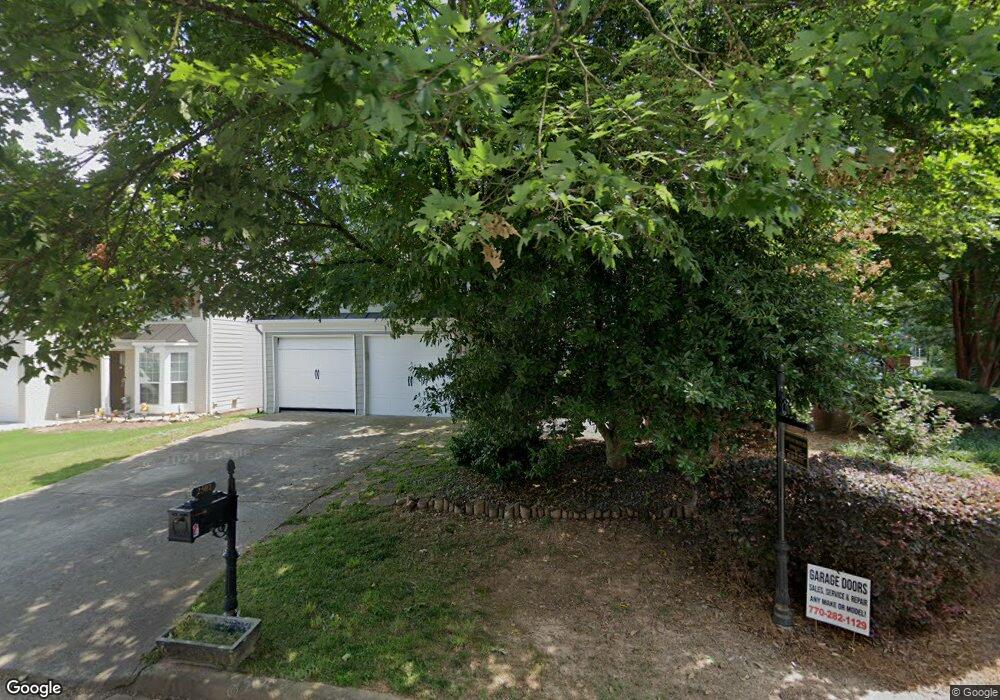
2502 Lullingstone Way SE Marietta, GA 30067
Powers Park NeighborhoodEstimated Value: $428,365 - $500,000
3
Beds
3
Baths
1,862
Sq Ft
$250/Sq Ft
Est. Value
About This Home
This home is located at 2502 Lullingstone Way SE, Marietta, GA 30067 and is currently estimated at $466,091, approximately $250 per square foot. 2502 Lullingstone Way SE is a home located in Cobb County with nearby schools including Sedalia Park Elementary School, East Cobb Middle School, and Wheeler High School.
Ownership History
Date
Name
Owned For
Owner Type
Purchase Details
Closed on
Jan 14, 2025
Sold by
Oliver Barbara T
Bought by
Barbara Tatum Oliver Revocable Trust and Oliver
Current Estimated Value
Purchase Details
Closed on
May 7, 2020
Sold by
Oliver Mark
Bought by
Oliver Barbara T
Purchase Details
Closed on
Dec 15, 2006
Sold by
Dingle Renikka
Bought by
Oliver Mark
Home Financials for this Owner
Home Financials are based on the most recent Mortgage that was taken out on this home.
Original Mortgage
$229,400
Interest Rate
6.1%
Mortgage Type
Trade
Purchase Details
Closed on
Mar 5, 2004
Sold by
Lu Jeff K
Bought by
Dingle Renikka
Home Financials for this Owner
Home Financials are based on the most recent Mortgage that was taken out on this home.
Original Mortgage
$170,700
Interest Rate
5.5%
Mortgage Type
New Conventional
Purchase Details
Closed on
Oct 31, 1996
Sold by
Pulte Home Corp
Bought by
Lu Jeff K
Create a Home Valuation Report for This Property
The Home Valuation Report is an in-depth analysis detailing your home's value as well as a comparison with similar homes in the area
Home Values in the Area
Average Home Value in this Area
Purchase History
| Date | Buyer | Sale Price | Title Company |
|---|---|---|---|
| Barbara Tatum Oliver Revocable Trust | -- | None Listed On Document | |
| Barbara Tatum Oliver Revocable Trust | -- | None Listed On Document | |
| Oliver Barbara T | -- | None Available | |
| Oliver Mark | $229,400 | -- | |
| Dingle Renikka | $213,500 | -- | |
| Lu Jeff K | $146,900 | -- |
Source: Public Records
Mortgage History
| Date | Status | Borrower | Loan Amount |
|---|---|---|---|
| Previous Owner | Oliver Mark | $229,400 | |
| Previous Owner | Dingle Renikka | $170,700 | |
| Closed | Lu Jeff K | $0 |
Source: Public Records
Tax History Compared to Growth
Tax History
| Year | Tax Paid | Tax Assessment Tax Assessment Total Assessment is a certain percentage of the fair market value that is determined by local assessors to be the total taxable value of land and additions on the property. | Land | Improvement |
|---|---|---|---|---|
| 2025 | $5,044 | $167,392 | $44,000 | $123,392 |
| 2024 | $5,047 | $167,392 | $44,000 | $123,392 |
| 2023 | $4,737 | $157,128 | $32,000 | $125,128 |
| 2022 | $4,769 | $157,128 | $32,000 | $125,128 |
| 2021 | $3,755 | $123,736 | $32,000 | $91,736 |
| 2020 | $2,958 | $112,664 | $32,000 | $80,664 |
| 2019 | $2,958 | $112,664 | $32,000 | $80,664 |
| 2018 | $2,779 | $104,448 | $32,000 | $72,448 |
| 2017 | $2,357 | $91,016 | $30,000 | $61,016 |
| 2016 | $2,358 | $91,016 | $30,000 | $61,016 |
| 2015 | $2,175 | $82,664 | $30,000 | $52,664 |
| 2014 | $2,194 | $82,664 | $0 | $0 |
Source: Public Records
Map
Nearby Homes
- 558 Lullingstone Dr SE
- 830 Bonnie Glen Dr SE
- 789 Gardenside Cir SE
- 2160 Palmyra Dr SE
- 2330 Trellis Ln SE
- 708 Hanover Ln SE
- 2223 Runnymead Ridge SE
- 2238 Surrey Ct SE
- 2240 Runnymead Ridge SE
- 2514 Sunny Ln SE
- 2409 Powers Ferry Dr SE
- 489 Little Rd SE
- 2490 Freydale Rd SE
- 2471 Cedar Brook W
- 2484 Cedar Canyon Rd SE
- 2497 Cedar Canyon Place SE
- 2952 Chipmunk Trail SE
- 61 Holt Rd NE
- 654 Grove Pkwy SE
- 935 Bobcat Ct SE
- 2504 Lullingstone Way SE
- 2506 Lullingstone Way SE
- 2531 Boxbourne Ct SE
- 2533 Boxbourne Ct SE
- 522 Stepney Ct SE
- 2508 Lullingstone Way SE
- 2535 Boxbourne Ct SE Unit 2
- 2530 Boxbourne Ct SE
- 2530 2530 Boxbourne Ct
- 523 Stepney Ct SE Unit 1
- 520 Stepney Ct SE
- 2537 Boxbourne Ct SE
- 2510 Lullingstone Way SE
- 2539 Boxbourne Ct SE
- 518 Stepney Ct SE
- 521 Stepney Ct SE
- 2532 Boxbourne Ct SE
- 2512 Lullingstone Way SE
- 2509 Lullingstone Way SE
- 519 Stepney Ct SE