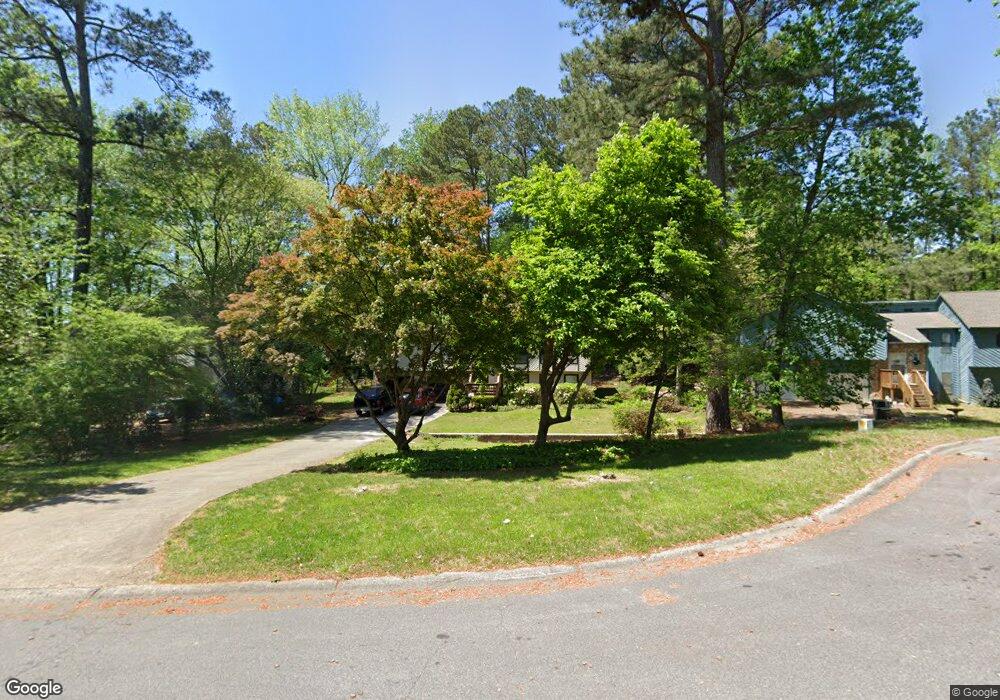
2502 Sawmill Rd SW Marietta, GA 30064
Estimated Value: $283,000 - $395,000
3
Beds
2
Baths
1,578
Sq Ft
$221/Sq Ft
Est. Value
About This Home
This home is located at 2502 Sawmill Rd SW, Marietta, GA 30064 and is currently estimated at $348,953, approximately $221 per square foot. 2502 Sawmill Rd SW is a home located in Cobb County with nearby schools including Hollydale Elementary School, Smitha Middle School, and Osborne High School.
Ownership History
Date
Name
Owned For
Owner Type
Purchase Details
Closed on
Sep 27, 2024
Sold by
James Lynn Janeway Jr Revocable Trust and Janeway James Lynn
Bought by
Dgs Residential Properties Llc
Current Estimated Value
Home Financials for this Owner
Home Financials are based on the most recent Mortgage that was taken out on this home.
Original Mortgage
$288,757
Interest Rate
6.35%
Mortgage Type
Construction
Purchase Details
Closed on
Jan 8, 2024
Sold by
Janeway James Lynn
Bought by
James Lynn Janeway Jr Revocable Trust and Janeway
Purchase Details
Closed on
Apr 4, 2021
Sold by
Janeway James Lynn and Janeway Ola Barbara
Bought by
Janeway James Lynn and Janeway Ola Barbara
Purchase Details
Closed on
Nov 10, 1998
Sold by
Dime Savings Bank Of New York
Bought by
Landmark Realty Co
Create a Home Valuation Report for This Property
The Home Valuation Report is an in-depth analysis detailing your home's value as well as a comparison with similar homes in the area
Home Values in the Area
Average Home Value in this Area
Purchase History
| Date | Buyer | Sale Price | Title Company |
|---|---|---|---|
| Dgs Residential Properties Llc | $280,000 | None Listed On Document | |
| James Lynn Janeway Jr Revocable Trust | -- | None Listed On Document | |
| Janeway James Lynn | -- | None Listed On Document | |
| Landmark Realty Co | -- | -- |
Source: Public Records
Mortgage History
| Date | Status | Borrower | Loan Amount |
|---|---|---|---|
| Closed | Dgs Residential Properties Llc | $288,757 |
Source: Public Records
Tax History Compared to Growth
Tax History
| Year | Tax Paid | Tax Assessment Tax Assessment Total Assessment is a certain percentage of the fair market value that is determined by local assessors to be the total taxable value of land and additions on the property. | Land | Improvement |
|---|---|---|---|---|
| 2025 | $3,614 | $119,936 | $22,800 | $97,136 |
| 2024 | $663 | $119,936 | $22,800 | $97,136 |
| 2023 | $457 | $119,936 | $22,800 | $97,136 |
| 2022 | $543 | $79,760 | $22,800 | $56,960 |
| 2021 | $503 | $66,128 | $14,000 | $52,128 |
| 2020 | $486 | $60,540 | $14,000 | $46,540 |
| 2019 | $486 | $60,540 | $14,000 | $46,540 |
| 2018 | $432 | $45,160 | $8,000 | $37,160 |
| 2017 | $377 | $45,160 | $8,000 | $37,160 |
| 2016 | $307 | $37,908 | $8,000 | $29,908 |
| 2015 | $327 | $37,908 | $8,000 | $29,908 |
| 2014 | $174 | $23,036 | $0 | $0 |
Source: Public Records
Map
Nearby Homes
- 2608 Foxwood Place SW Unit IV
- 2626 Smith Ave SW
- 2554 Red Barn Rd SW
- 0 Red Barn Rd SW Unit 7583499
- 0 Red Barn Rd SW Unit 10526807
- 2625 Deerfield Cir SW
- 2614 Smith Ave SW
- 2450 Horseshoe Bend Rd SW
- 2672 Holmes Mill Place SW
- 2705 Owens Ave SW
- 2599 Candler Way SW
- 2720 Cold Springs Trail SW
- 2415 Bankstone Dr SW
- 2448 Wood Meadows Dr SW
- 2730 Hembree Rd SW
- 2752 Owens Ave SW Unit 5
- 2723 Horseshoe Creek Dr SW
- 2166 Derbyshire Dr SW
- 2318 Powder Springs Rd SW
- 2510 Sawmill Rd SW
- 2494 Sawmill Rd SW Unit 6
- 2567 Deerfield Cir SW
- 2579 Deerfield Cir SW
- 2486 Sawmill Rd SW
- 2518 Sawmill Rd SW
- 2505 Sawmill Rd SW
- 2511 Deerfield Dr
- 2568 Deerfield Cir SW
- 2600 Foxwood Place SW
- 2265 Deerfield Cir
- 2583 Deerfield Cir SW Unit 4
- 2513 Sawmill Rd SW Unit 6
- 2619 Branson Place SW Unit III
- 2621 Branson Place SW
- 2526 Sawmill Rd SW Unit IV
- 2478 Sawmill Rd SW
- 0 Foxwood Place
- 2623 Branson Place SW Unit 3
- 2574 Deerfield Cir SW