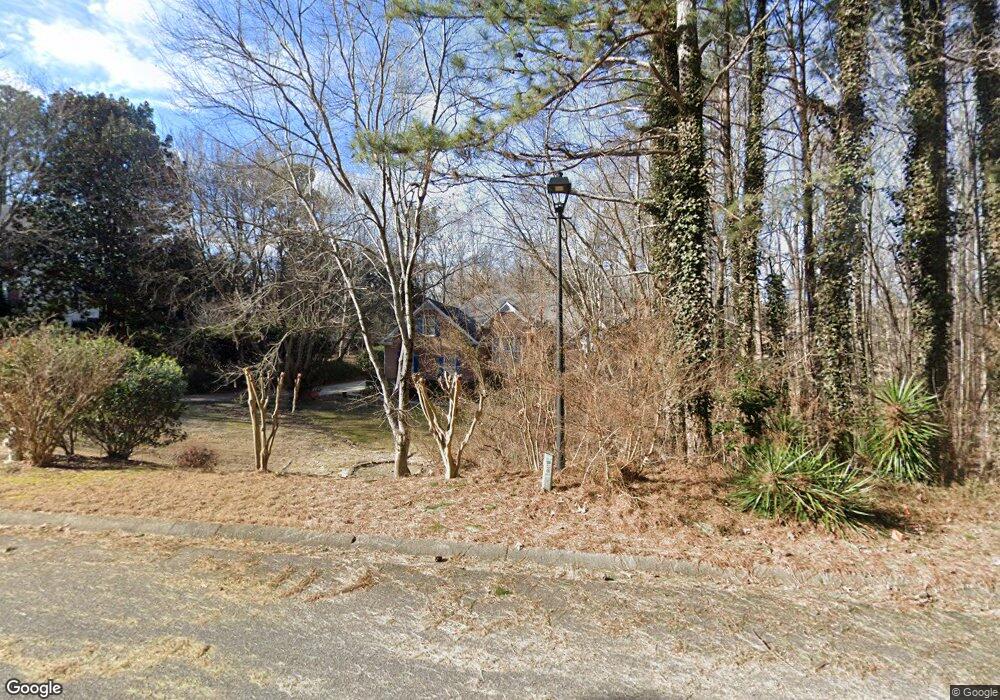
2502 Windchase Ct Buford, GA 30518
Estimated Value: $476,000 - $741,677
4
Beds
4
Baths
2,368
Sq Ft
$258/Sq Ft
Est. Value
About This Home
This home is located at 2502 Windchase Ct, Buford, GA 30518 and is currently estimated at $611,919, approximately $258 per square foot. 2502 Windchase Ct is a home located in Gwinnett County with nearby schools including White Oak Elementary School, Lanier Middle School, and Lanier High School.
Ownership History
Date
Name
Owned For
Owner Type
Purchase Details
Closed on
Jul 28, 2005
Sold by
Springston Richard M and Springston Marleen
Bought by
Miller Jerry C and Miller Mary
Current Estimated Value
Purchase Details
Closed on
Jun 11, 2001
Sold by
Springston Richard M
Bought by
Springston Richard M and Springston Marleen M
Home Financials for this Owner
Home Financials are based on the most recent Mortgage that was taken out on this home.
Original Mortgage
$165,850
Interest Rate
7.06%
Mortgage Type
New Conventional
Purchase Details
Closed on
Apr 16, 2001
Sold by
Boggs Kenneth R and Boggs Kathryn L
Bought by
Boggs Kathryn C
Home Financials for this Owner
Home Financials are based on the most recent Mortgage that was taken out on this home.
Original Mortgage
$165,850
Interest Rate
7.06%
Mortgage Type
New Conventional
Purchase Details
Closed on
Feb 26, 1993
Sold by
Fichter Savage
Bought by
Boggs Kenneth C Kathryn
Create a Home Valuation Report for This Property
The Home Valuation Report is an in-depth analysis detailing your home's value as well as a comparison with similar homes in the area
Home Values in the Area
Average Home Value in this Area
Purchase History
| Date | Buyer | Sale Price | Title Company |
|---|---|---|---|
| Miller Jerry C | $285,000 | -- | |
| Springston Richard M | -- | -- | |
| Springston Richard M | $245,000 | -- | |
| Boggs Kathryn C | -- | -- | |
| Boggs Kenneth C Kathryn | $152,500 | -- |
Source: Public Records
Mortgage History
| Date | Status | Borrower | Loan Amount |
|---|---|---|---|
| Previous Owner | Springston Richard M | $165,850 | |
| Previous Owner | Boggs Kathryn C | $60,000 | |
| Closed | Boggs Kenneth C Kathryn | -- |
Source: Public Records
Tax History Compared to Growth
Tax History
| Year | Tax Paid | Tax Assessment Tax Assessment Total Assessment is a certain percentage of the fair market value that is determined by local assessors to be the total taxable value of land and additions on the property. | Land | Improvement |
|---|---|---|---|---|
| 2024 | $1,987 | $237,480 | $45,880 | $191,600 |
| 2023 | $1,987 | $188,840 | $29,880 | $158,960 |
| 2022 | $1,881 | $188,840 | $29,880 | $158,960 |
| 2021 | $1,869 | $141,760 | $29,880 | $111,880 |
| 2020 | $1,837 | $125,360 | $22,680 | $102,680 |
| 2019 | $1,699 | $125,360 | $22,680 | $102,680 |
| 2018 | $1,681 | $125,360 | $22,680 | $102,680 |
| 2016 | $1,715 | $108,480 | $22,680 | $85,800 |
| 2015 | $1,748 | $108,480 | $22,680 | $85,800 |
| 2014 | -- | $96,200 | $22,680 | $73,520 |
Source: Public Records
Map
Nearby Homes
- 2482 Windchase Ct
- 5697 Frontier Walk Ln
- 5735 Lake Windsor Pkwy
- 5571 Shadburn Ferry Rd
- 2416 Sterling Manor Dr
- 5995 Lake Windsor Pkwy Unit 1
- 5839 Lakeshore Dr
- 5450 N Richland Creek Rd
- 5775 Lakeshore Dr
- 6265 Lake Windsor Pkwy
- 5435 Shadburn Ferry Rd
- 6030 Chimney Springs Rd
- 5601 Creek Dale Way
- 5600 Creek Dale Way
- 5871 Dolvin Ln
- 5832 Bay View Dr
- 6708 Bass Cir
- 2492 Windchase Ct
- 2507 Windchase Ct
- 2507 Windchase Ct Unit 7
- 2522 Windchase Ct
- 2527 Windchase Ct
- 2495 Ridgehurst Dr
- 2487 Windchase Ct
- 2515 Ridgehurst Dr
- 5740 Windchase Dr
- 5720 Windchase Dr
- 5710 Windchase Dr
- 5750 Windchase Dr
- 5800 Windchase Dr
- 5700 Windchase Dr
- 0 Windchase Dr Unit 7354055
- 0 Windchase Dr Unit 7169703
- 0 Windchase Dr Unit 7164066
- 0 Windchase Dr Unit 7127157
- 0 Windchase Dr Unit 8322843
- 0 Windchase Dr Unit 8222399