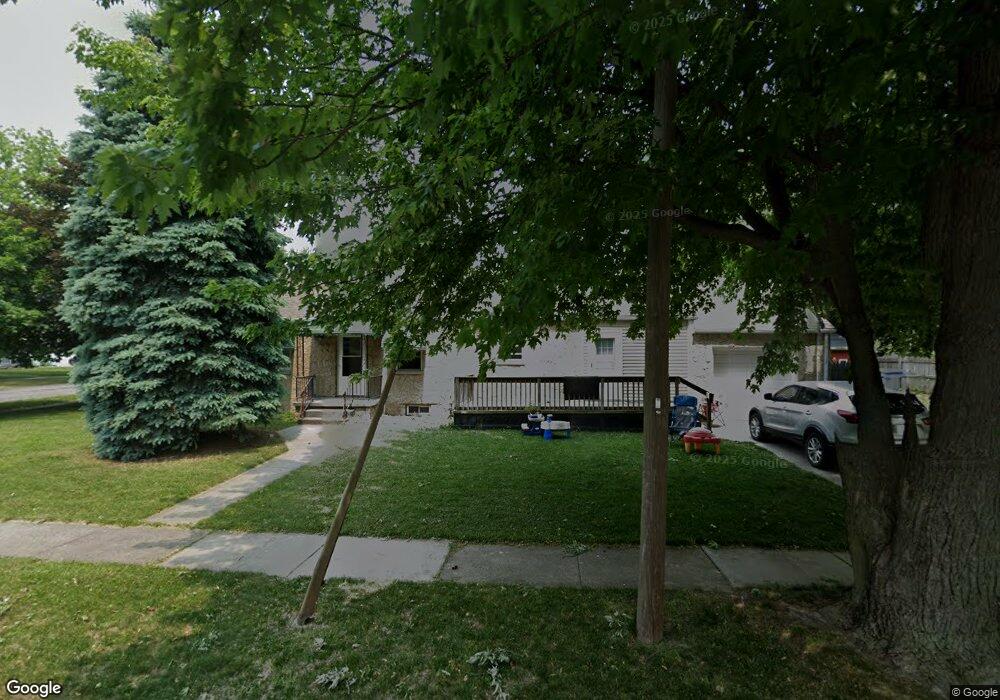
2503 102nd St Toledo, OH 43611
Point Place NeighborhoodEstimated Value: $128,000 - $148,000
2
Beds
1
Bath
1,030
Sq Ft
$136/Sq Ft
Est. Value
About This Home
This home is located at 2503 102nd St, Toledo, OH 43611 and is currently estimated at $139,866, approximately $135 per square foot. 2503 102nd St is a home located in Lucas County with nearby schools including Ottawa River Elementary School, Woodward High School, and Imagine Environmental Science Academy.
Ownership History
Date
Name
Owned For
Owner Type
Purchase Details
Closed on
May 7, 2009
Sold by
Futey Kenneth R and Futey Tina M
Bought by
Jourdain Terrey L
Current Estimated Value
Purchase Details
Closed on
Jun 17, 2008
Sold by
Wells Fargo Financial Ohio 1 Inc
Bought by
Futey Kenneth R
Purchase Details
Closed on
Aug 20, 2007
Sold by
Jankowski Carolyn J
Bought by
Wells Fargo Financial America Inc
Purchase Details
Closed on
May 27, 2005
Sold by
Jankowski James A and Jankowski Carolyn J
Bought by
Wells Fargo Financial
Create a Home Valuation Report for This Property
The Home Valuation Report is an in-depth analysis detailing your home's value as well as a comparison with similar homes in the area
Home Values in the Area
Average Home Value in this Area
Purchase History
| Date | Buyer | Sale Price | Title Company |
|---|---|---|---|
| Jourdain Terrey L | $47,500 | Attorney | |
| Futey Kenneth R | $28,600 | Prism Title & Closing Servic | |
| Wells Fargo Financial America Inc | $76,000 | Ohio Title Corp | |
| Wells Fargo Financial | -- | -- |
Source: Public Records
Tax History
| Year | Tax Paid | Tax Assessment Tax Assessment Total Assessment is a certain percentage of the fair market value that is determined by local assessors to be the total taxable value of land and additions on the property. | Land | Improvement |
|---|---|---|---|---|
| 2025 | -- | $40,985 | $5,880 | $35,105 |
| 2024 | $1,353 | $40,985 | $5,880 | $35,105 |
| 2023 | $2,062 | $28,805 | $5,320 | $23,485 |
| 2022 | $2,047 | $28,805 | $5,320 | $23,485 |
| 2021 | $2,105 | $28,805 | $5,320 | $23,485 |
| 2020 | $2,062 | $24,360 | $4,410 | $19,950 |
| 2019 | $1,988 | $24,360 | $4,410 | $19,950 |
| 2018 | $1,928 | $24,360 | $4,410 | $19,950 |
| 2017 | $1,811 | $21,000 | $6,545 | $14,455 |
| 2016 | $1,838 | $60,000 | $18,700 | $41,300 |
| 2015 | $1,855 | $60,000 | $18,700 | $41,300 |
| 2014 | $1,358 | $21,010 | $6,550 | $14,460 |
| 2013 | $1,358 | $21,010 | $6,550 | $14,460 |
Source: Public Records
Map
Nearby Homes
- 4532 290th St
- 4539 290th St
- 2426 106th St
- 2352 108th St
- 4745 Ottawa Trail Rd
- 2857 113th St
- 2934 S 109th St
- 2750 119th St
- 2749 119th St
- 2831 118th St
- 2835 121st St
- 1945 Grimes Golden Dr
- 5202 302nd St
- 4220 Northshire Rd
- 3056 121st St
- 5314 Suder Ave
- 5301 303rd St
- 4251 Northcroft Ln
- 5433 Brophy Dr
- 5414 303rd St
Your Personal Tour Guide
Ask me questions while you tour the home.