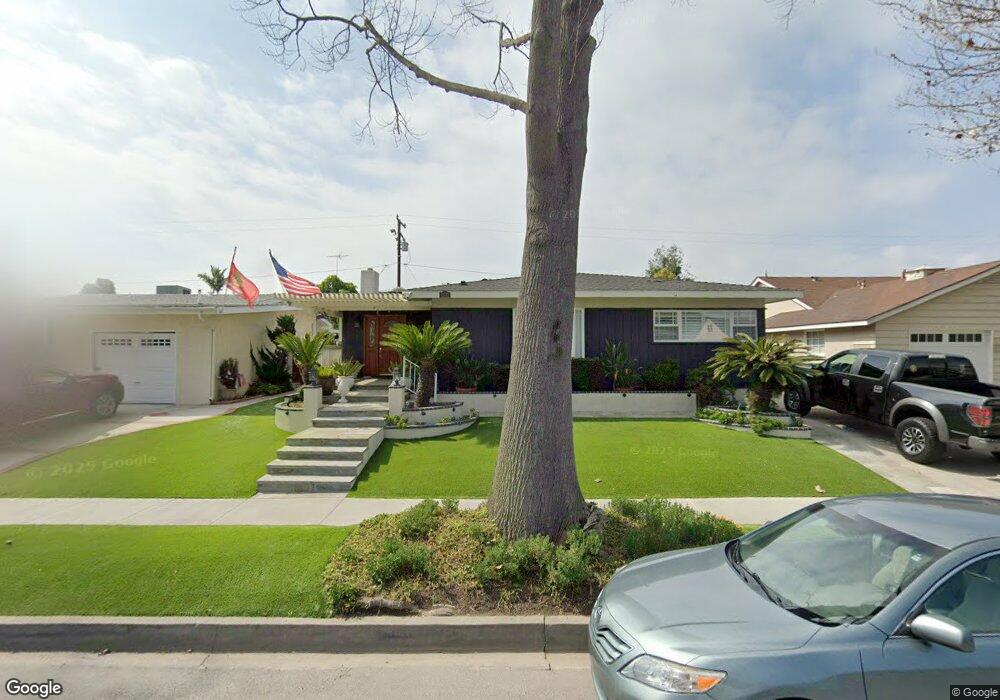
2503 Nipomo Ave Long Beach, CA 90815
El Dorado Park NeighborhoodEstimated Value: $1,083,000 - $1,133,000
3
Beds
2
Baths
1,694
Sq Ft
$656/Sq Ft
Est. Value
About This Home
This home is located at 2503 Nipomo Ave, Long Beach, CA 90815 and is currently estimated at $1,111,019, approximately $655 per square foot. 2503 Nipomo Ave is a home located in Los Angeles County with nearby schools including Stanford Middle School, Millikan High School, and Los Altos Grace Schools.
Ownership History
Date
Name
Owned For
Owner Type
Purchase Details
Closed on
Apr 30, 2013
Sold by
Hitchcock Sean R
Bought by
Hitchcock Sean R and The Sean R Hitchcock Separate Property T
Current Estimated Value
Purchase Details
Closed on
Apr 3, 2000
Sold by
Mckenna Joe S and Joe S Mckenna Family Trust
Bought by
Hitchcock Sean
Home Financials for this Owner
Home Financials are based on the most recent Mortgage that was taken out on this home.
Original Mortgage
$150,480
Outstanding Balance
$51,665
Interest Rate
8.26%
Mortgage Type
Seller Take Back
Estimated Equity
$1,059,354
Purchase Details
Closed on
Feb 16, 1998
Sold by
Hitchcock Sean R
Bought by
Hitchcock Sean R and Hitchcock Linda
Home Financials for this Owner
Home Financials are based on the most recent Mortgage that was taken out on this home.
Original Mortgage
$204,000
Interest Rate
6.99%
Create a Home Valuation Report for This Property
The Home Valuation Report is an in-depth analysis detailing your home's value as well as a comparison with similar homes in the area
Home Values in the Area
Average Home Value in this Area
Purchase History
| Date | Buyer | Sale Price | Title Company |
|---|---|---|---|
| Hitchcock Sean R | -- | None Available | |
| Hitchcock Sean R | -- | None Available | |
| Hitchcock Sean | $198,000 | Gateway Title | |
| Hitchcock Sean R | -- | Gateway Title Company |
Source: Public Records
Mortgage History
| Date | Status | Borrower | Loan Amount |
|---|---|---|---|
| Open | Hitchcock Sean | $150,480 | |
| Previous Owner | Hitchcock Sean R | $204,000 |
Source: Public Records
Tax History Compared to Growth
Tax History
| Year | Tax Paid | Tax Assessment Tax Assessment Total Assessment is a certain percentage of the fair market value that is determined by local assessors to be the total taxable value of land and additions on the property. | Land | Improvement |
|---|---|---|---|---|
| 2025 | $5,335 | $402,533 | $236,978 | $165,555 |
| 2024 | $5,335 | $394,641 | $232,332 | $162,309 |
| 2023 | $5,253 | $386,904 | $227,777 | $159,127 |
| 2022 | $4,941 | $379,318 | $223,311 | $156,007 |
| 2021 | $4,846 | $371,882 | $218,933 | $152,949 |
| 2019 | $4,691 | $360,854 | $212,441 | $148,413 |
| 2018 | $4,506 | $353,779 | $208,276 | $145,503 |
| 2016 | $4,135 | $340,043 | $200,190 | $139,853 |
| 2015 | $3,971 | $334,936 | $197,183 | $137,753 |
| 2014 | $3,944 | $328,376 | $193,321 | $135,055 |
Source: Public Records
Map
Nearby Homes
- 2511 Nipomo Ave
- 2541 Ostrom Ave
- 2440 Ostrom Ave
- 2534 Petaluma Ave
- 2725 Ladoga Ave
- 6449 E Los Arcos St
- 2729 N Studebaker Rd
- 6361 E Deborah St
- 2137 Ostrom Ave
- 6241 E Vernon St
- 2154 Kallin Ave
- 2103 Roxanne Ave
- 2050 Josie Ave
- 2260 Tevis Ave
- 3032 Ostrom Ave
- 2541 Gondar Ave
- 2690 Senasac Ave
- 6948 E Los Santos Dr
- 2180 Mcnab Ave
- 1956 Volk Ave
- 2455 Nipomo Ave
- 2506 Monogram Ave
- 2515 Nipomo Ave
- 2449 Nipomo Ave
- 2512 Monogram Ave
- 2502 Monogram Ave
- 2518 Monogram Ave
- 2474 Monogram Ave
- 2502 Nipomo Ave
- 2521 Nipomo Ave
- 2508 Nipomo Ave
- 2443 Nipomo Ave
- 2452 Nipomo Ave
- 2512 Nipomo Ave
- 2522 Monogram Ave
- 2468 Monogram Ave
- 2446 Nipomo Ave
- 2518 Nipomo Ave
- 2527 Nipomo Ave
- 2439 Nipomo Ave