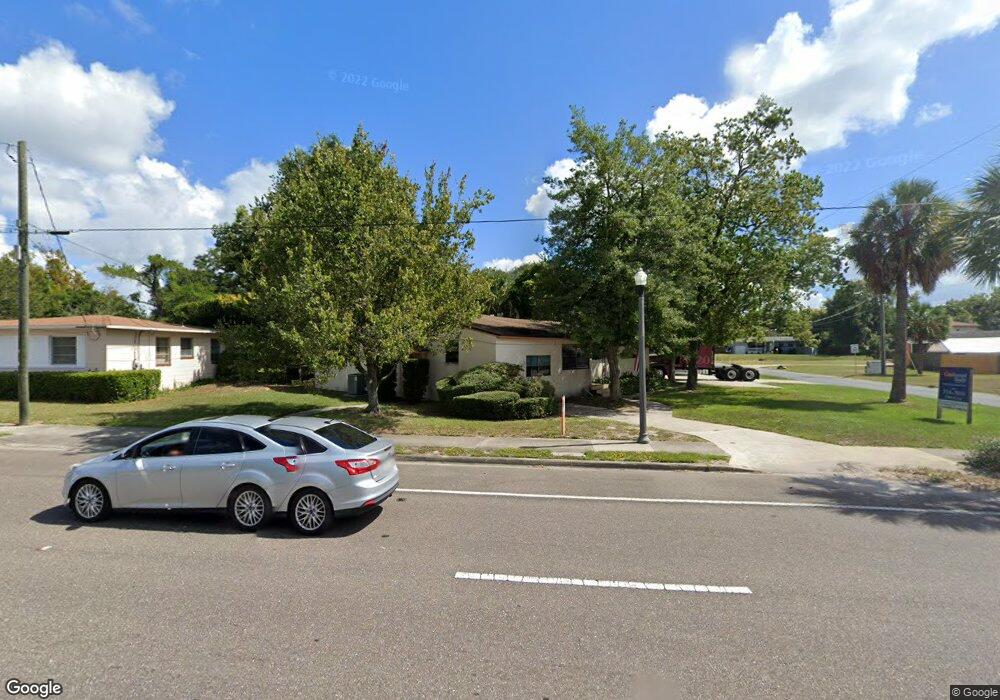
2503 Rogero Rd Jacksonville, FL 32211
Lake Lucina NeighborhoodEstimated Value: $254,000 - $276,000
4
Beds
3
Baths
2,197
Sq Ft
$121/Sq Ft
Est. Value
About This Home
This home is located at 2503 Rogero Rd, Jacksonville, FL 32211 and is currently estimated at $266,843, approximately $121 per square foot. 2503 Rogero Rd is a home located in Duval County with nearby schools including Lake Lucina Elementary School, Arlington Middle School, and Terry Parker High School.
Ownership History
Date
Name
Owned For
Owner Type
Purchase Details
Closed on
Feb 6, 2025
Sold by
Corley Richard L and Corley Carol J
Bought by
Crossmen Cleaning Solutions Llc
Current Estimated Value
Home Financials for this Owner
Home Financials are based on the most recent Mortgage that was taken out on this home.
Original Mortgage
$325,000
Outstanding Balance
$322,081
Interest Rate
6.91%
Mortgage Type
New Conventional
Estimated Equity
-$55,238
Purchase Details
Closed on
Jan 29, 2016
Sold by
Harper James M and Harper Julia R
Bought by
Corley Richard L and Corley Carol J
Home Financials for this Owner
Home Financials are based on the most recent Mortgage that was taken out on this home.
Original Mortgage
$129,000
Interest Rate
3.98%
Mortgage Type
Balloon
Create a Home Valuation Report for This Property
The Home Valuation Report is an in-depth analysis detailing your home's value as well as a comparison with similar homes in the area
Home Values in the Area
Average Home Value in this Area
Purchase History
| Date | Buyer | Sale Price | Title Company |
|---|---|---|---|
| Crossmen Cleaning Solutions Llc | $250,000 | None Listed On Document | |
| Crossmen Cleaning Solutions Llc | $250,000 | None Listed On Document | |
| Corley Richard L | $125,000 | Osborne & Sheffield Title Sv |
Source: Public Records
Mortgage History
| Date | Status | Borrower | Loan Amount |
|---|---|---|---|
| Open | Crossmen Cleaning Solutions Llc | $325,000 | |
| Closed | Crossmen Cleaning Solutions Llc | $325,000 | |
| Previous Owner | Corley Richard L | $129,000 |
Source: Public Records
Tax History Compared to Growth
Tax History
| Year | Tax Paid | Tax Assessment Tax Assessment Total Assessment is a certain percentage of the fair market value that is determined by local assessors to be the total taxable value of land and additions on the property. | Land | Improvement |
|---|---|---|---|---|
| 2025 | $3,845 | $219,951 | $58,704 | $161,247 |
| 2024 | $3,845 | $220,193 | $54,000 | $166,193 |
| 2023 | $3,663 | $222,061 | $48,000 | $174,061 |
| 2022 | $3,114 | $195,391 | $30,000 | $165,391 |
| 2021 | $2,837 | $163,503 | $30,000 | $133,503 |
| 2020 | $2,625 | $152,394 | $24,000 | $128,394 |
| 2019 | $2,438 | $139,749 | $24,000 | $115,749 |
| 2018 | $2,203 | $118,762 | $24,000 | $94,762 |
| 2017 | $2,016 | $105,151 | $24,000 | $81,151 |
| 2016 | $2,350 | $121,275 | $0 | $0 |
| 2015 | $2,265 | $114,670 | $0 | $0 |
| 2014 | $2,180 | $108,967 | $0 | $0 |
Source: Public Records
Map
Nearby Homes
- 2535 Rogero Rd
- 2423 Green Oak Dr
- 2511 Gaillardia Rd
- 2342 Pine Summit Dr E
- 6538 Pine Summit Dr
- 6544 Blackwood Dr
- 2436 Red Oak Dr
- 6903 Mayapple Rd
- 6316 Pine Summit Dr
- 6221 Ashwood Ln
- 6552 Shady Oak Dr
- 6816 Lotus Rd S
- 6352 Sprinkle Dr N
- 2944 Corkwood Rd W
- 6938 Corkwood Rd
- 6331 Shady Oak Dr
- 2717 Arlex Dr E
- 6034 Columbine Dr
- 6327 Elise Dr
- 6620 Barkwood Dr
- 2511 Rogero Rd
- 2504 Caladium Rd
- 2512 Caladium Rd
- 2521 Rogero Rd
- 6504 Columbine Dr Unit 3
- 2504 Rogero Rd
- 2520 Caladium Rd
- 6528 Columbine Dr
- 2529 Rogero Rd
- 2520 Rogero Rd
- 2441 Rogero Rd
- 2528 Caladium Rd
- 2454 Rogero Rd
- 2442 Caladium Rd
- 2528 Rogero Rd
- 2534 Caladium Rd
- 2503 Caladium Rd
- 2442 Rogero Rd
- 2431 Rogero Rd
- 2432 Caladium Rd