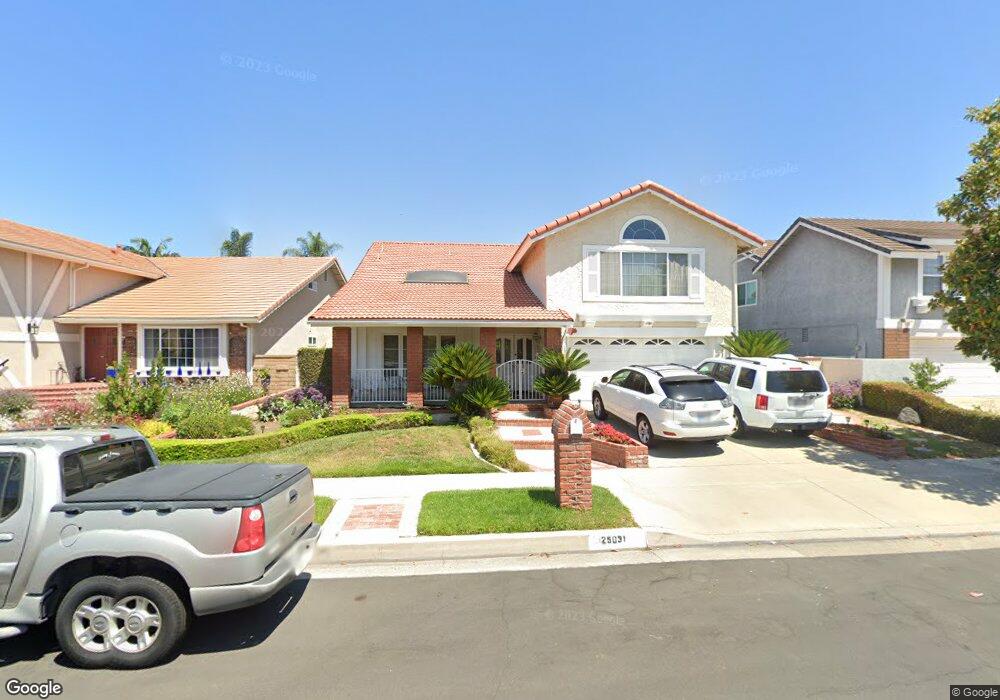
25031 Shaver Lake Cir Lake Forest, CA 92630
Estimated Value: $1,461,950 - $1,587,000
4
Beds
3
Baths
2,861
Sq Ft
$540/Sq Ft
Est. Value
About This Home
This home is located at 25031 Shaver Lake Cir, Lake Forest, CA 92630 and is currently estimated at $1,544,738, approximately $539 per square foot. 25031 Shaver Lake Cir is a home located in Orange County with nearby schools including Rancho Canada Elementary School, Serrano Intermediate School, and El Toro High School.
Ownership History
Date
Name
Owned For
Owner Type
Purchase Details
Closed on
May 28, 2014
Sold by
Obrien Michael Patrick
Bought by
Obrien Lisa Marie
Current Estimated Value
Purchase Details
Closed on
May 8, 2014
Sold by
Brien Lisa Marie O
Bought by
Grizzell James R and Grizzell Sandra J
Purchase Details
Closed on
Mar 2, 2004
Sold by
Grizzell Sandra J
Bought by
Grizzell James R
Home Financials for this Owner
Home Financials are based on the most recent Mortgage that was taken out on this home.
Original Mortgage
$270,000
Interest Rate
5.61%
Mortgage Type
New Conventional
Purchase Details
Closed on
Dec 29, 2003
Sold by
Grizzell James R
Bought by
Obrien Lisa Marie
Purchase Details
Closed on
Aug 13, 1996
Sold by
Robert Grizzell James and Robert Jean Sandra
Bought by
Obrien Lisa Marie
Create a Home Valuation Report for This Property
The Home Valuation Report is an in-depth analysis detailing your home's value as well as a comparison with similar homes in the area
Home Values in the Area
Average Home Value in this Area
Purchase History
| Date | Buyer | Sale Price | Title Company |
|---|---|---|---|
| Obrien Lisa Marie | -- | Chicago Title Insurance Co | |
| Grizzell James R | -- | Chicago Title Insurance Co | |
| Grizzell James R | -- | Equity Title Company | |
| Obrien Lisa Marie | -- | -- | |
| Grizzell James R | -- | -- | |
| Obrien Lisa Marie | -- | -- |
Source: Public Records
Mortgage History
| Date | Status | Borrower | Loan Amount |
|---|---|---|---|
| Previous Owner | Grizzell James R | $270,000 |
Source: Public Records
Tax History Compared to Growth
Tax History
| Year | Tax Paid | Tax Assessment Tax Assessment Total Assessment is a certain percentage of the fair market value that is determined by local assessors to be the total taxable value of land and additions on the property. | Land | Improvement |
|---|---|---|---|---|
| 2025 | $4,344 | $433,212 | $105,650 | $327,562 |
| 2024 | $4,344 | $424,718 | $103,578 | $321,140 |
| 2023 | $4,241 | $416,391 | $101,547 | $314,844 |
| 2022 | $4,164 | $408,227 | $99,556 | $308,671 |
| 2021 | $4,080 | $400,223 | $97,604 | $302,619 |
| 2020 | $4,042 | $396,120 | $96,603 | $299,517 |
| 2019 | $3,961 | $388,353 | $94,708 | $293,645 |
| 2018 | $3,885 | $380,739 | $92,851 | $287,888 |
| 2017 | $3,806 | $373,274 | $91,030 | $282,244 |
| 2016 | $3,742 | $365,955 | $89,245 | $276,710 |
| 2015 | $3,696 | $360,459 | $87,905 | $272,554 |
| 2014 | $3,687 | $353,399 | $86,183 | $267,216 |
Source: Public Records
Map
Nearby Homes
- 25011 Mammoth Cir
- 25152 Mammoth Cir
- 25154 Mammoth Cir
- 24975 Heartwood Cir
- 24771 Summerwind Ln
- 24966 Valley Rim Terrace
- 24708 Toledo Ln
- 25162 Chestnutwood Unit 47
- 21886 Winnebago Ln
- 24946 Ravenswood
- 24771 Camino Villa
- 21472 Firwood Unit 9
- 24802 Forest Knoll Ln
- 21301 Calle Recreo
- 25495 Morningstar Rd
- 25272 Birch Grove Ln
- 21291 Calle Recreo
- 21324 Balsam Ln
- 24465 Peacock St
- 24481 Peacock St
- 25025 Shaver Lake Cir
- 25041 Shaver Lake Cir
- 25002 Pine Flat Cir
- 25051 Shaver Lake Cir
- 25012 Pine Flat Cir
- 25021 Shaver Lake Cir
- 25022 Pine Flat Cir
- 24996 Pine Flat Cir
- 25061 Shaver Lake Cir
- 25011 Shaver Lake Cir
- 25032 Shaver Lake Cir
- 25042 Shaver Lake Cir
- 25032 Pine Flat Cir
- 24992 Pine Flat Cir
- 25022 Shaver Lake Cir
- 25052 Shaver Lake Cir
- 25071 Shaver Lake Cir
- 25001 Shaver Lake Cir
- 25042 Pine Flat Cir
- 24982 Pine Flat Cir