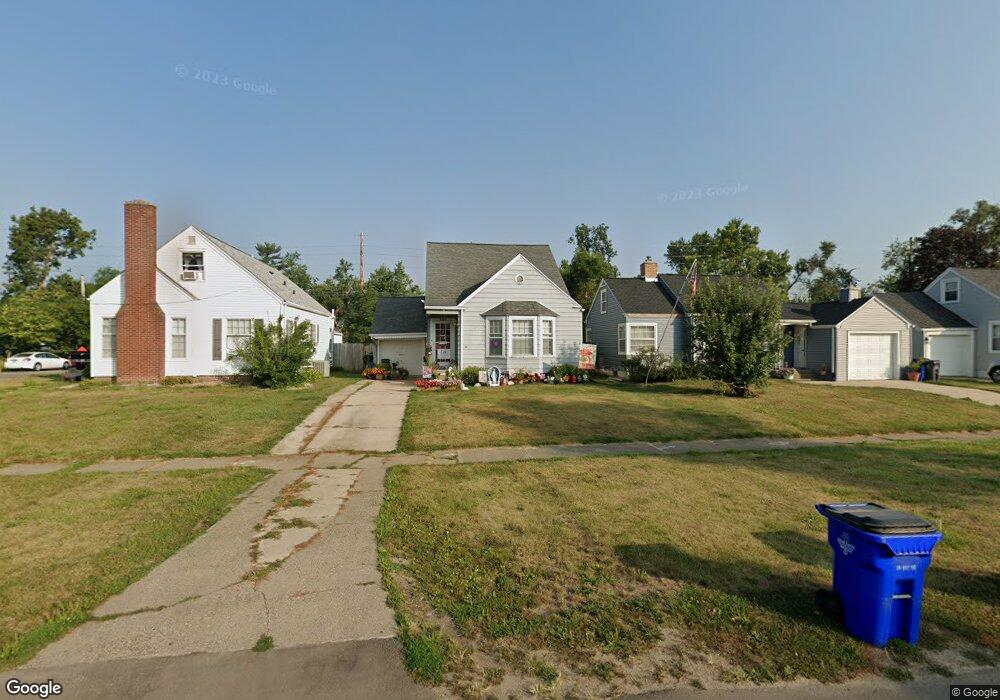
2504 E Ave NE Cedar Rapids, IA 52402
Mound View NeighborhoodEstimated Value: $172,000 - $184,000
3
Beds
2
Baths
1,275
Sq Ft
$140/Sq Ft
Est. Value
About This Home
This home is located at 2504 E Ave NE, Cedar Rapids, IA 52402 and is currently estimated at $178,093, approximately $139 per square foot. 2504 E Ave NE is a home located in Linn County with nearby schools including Franklin Middle School, George Washington High School, and St. Matthew School.
Ownership History
Date
Name
Owned For
Owner Type
Purchase Details
Closed on
Jul 25, 2008
Sold by
Banowetz Glen E and Banowetz Pamela D
Bought by
Cherion John M and Cherion Mary
Current Estimated Value
Home Financials for this Owner
Home Financials are based on the most recent Mortgage that was taken out on this home.
Original Mortgage
$116,078
Outstanding Balance
$75,979
Interest Rate
6.36%
Mortgage Type
FHA
Estimated Equity
$102,114
Purchase Details
Closed on
May 4, 2005
Sold by
Richardson Roland W and Richardson Sarah H
Bought by
Banowetz Glen E and Banowetz Pamela D
Purchase Details
Closed on
May 5, 1999
Sold by
Albright Leslie D and Albright Pamalea L
Bought by
Richardson Roland W and Richardson Sarah H
Purchase Details
Closed on
Dec 10, 1998
Sold by
Maxson Charles R and Maxson Annette J
Bought by
Richardson Roland W and Richardson Sarah H
Home Financials for this Owner
Home Financials are based on the most recent Mortgage that was taken out on this home.
Original Mortgage
$79,950
Interest Rate
6.95%
Create a Home Valuation Report for This Property
The Home Valuation Report is an in-depth analysis detailing your home's value as well as a comparison with similar homes in the area
Home Values in the Area
Average Home Value in this Area
Purchase History
| Date | Buyer | Sale Price | Title Company |
|---|---|---|---|
| Cherion John M | $117,500 | None Available | |
| Banowetz Glen E | $89,500 | -- | |
| Richardson Roland W | -- | -- | |
| Richardson Roland W | $79,500 | -- |
Source: Public Records
Mortgage History
| Date | Status | Borrower | Loan Amount |
|---|---|---|---|
| Open | Cherion John M | $116,078 | |
| Previous Owner | Richardson Roland W | $79,950 |
Source: Public Records
Tax History
| Year | Tax Paid | Tax Assessment Tax Assessment Total Assessment is a certain percentage of the fair market value that is determined by local assessors to be the total taxable value of land and additions on the property. | Land | Improvement |
|---|---|---|---|---|
| 2025 | $2,270 | $164,000 | $29,000 | $135,000 |
| 2024 | $2,596 | $154,400 | $27,000 | $127,400 |
| 2023 | $2,596 | $154,400 | $27,000 | $127,400 |
| 2022 | $2,342 | $135,300 | $24,000 | $111,300 |
| 2021 | $2,174 | $125,400 | $24,000 | $101,400 |
| 2020 | $2,174 | $110,400 | $20,000 | $90,400 |
| 2019 | $2,046 | $106,700 | $20,000 | $86,700 |
| 2018 | $1,984 | $106,700 | $20,000 | $86,700 |
| 2017 | $2,065 | $102,900 | $20,000 | $82,900 |
| 2016 | $2,065 | $100,500 | $20,000 | $80,500 |
| 2015 | $2,142 | $100,664 | $20,000 | $80,664 |
| 2014 | $2,142 | $105,362 | $20,000 | $85,362 |
| 2013 | $2,194 | $105,362 | $20,000 | $85,362 |
Source: Public Records
Map
Nearby Homes
- 700 25th St NE
- 2416 B Ave NE
- 521 29th St NE
- 208 24th St NE
- 2522 A Ave NE
- 203 27th St NE
- 435 20th St NE
- 409 20th St NE
- 2222 1st Ave NE Unit 305
- 2222 1st Ave NE Unit 107
- 2222 1st Ave NE Unit 307
- 2222 1st Ave NE
- 2222 1st Ave NE Unit 303
- 2222 1st Ave NE Unit 507
- 3018 E Ave NE
- 130 Thompson Dr SE Unit 214
- 130 Thompson Dr SE Unit 210
- 130 Thompson Dr SE Unit 308
- 430 Longwood Dr NE
- 100 Thompson Dr SE Unit 116
- 2502 E Ave NE
- 2510 E Ave NE
- 2514 E Ave NE
- 2520 E Ave NE
- 2434 E Ave NE
- 2424 D Ave NE
- 2524 E Ave NE
- 2428 E Ave NE
- 2420 D Ave NE
- 2414 D Ave NE
- 2600 E Ave NE
- 2424 E Ave NE
- 2419 E Ave NE
- 2501 Franklin Ave NE
- 2505 Franklin Ave NE
- 2509 Franklin Ave NE
- 2417 E Ave NE
- 2408 D Ave NE
- 2420 E Ave NE
- 2515 Franklin Ave NE
Your Personal Tour Guide
Ask me questions while you tour the home.