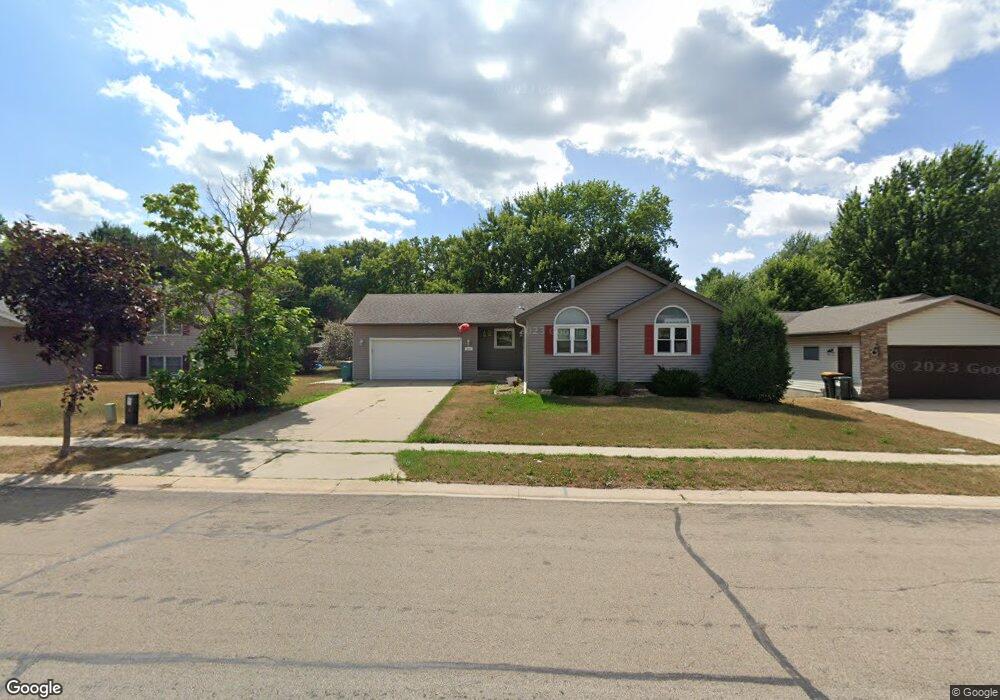
2505 20th Ave SE Rochester, MN 55904
Estimated Value: $322,000 - $383,000
4
Beds
2
Baths
2,382
Sq Ft
$149/Sq Ft
Est. Value
About This Home
This home is located at 2505 20th Ave SE, Rochester, MN 55904 and is currently estimated at $354,796, approximately $148 per square foot. 2505 20th Ave SE is a home located in Olmsted County with nearby schools including Pinewood Elementary School, Willow Creek Middle School, and Mayo Senior High School.
Ownership History
Date
Name
Owned For
Owner Type
Purchase Details
Closed on
Aug 1, 2018
Sold by
Chowdhury Sagar and Chowdhury Monica Boe
Bought by
Kelley Jon G and Kelley Bambi V M
Current Estimated Value
Home Financials for this Owner
Home Financials are based on the most recent Mortgage that was taken out on this home.
Original Mortgage
$232,000
Outstanding Balance
$201,483
Interest Rate
4.5%
Mortgage Type
VA
Estimated Equity
$153,313
Purchase Details
Closed on
Jun 9, 2016
Sold by
Scripture Robert M and Scripture Robyn J
Bought by
Chowdhury Sagar and Chowdhury Monica Booe
Home Financials for this Owner
Home Financials are based on the most recent Mortgage that was taken out on this home.
Original Mortgage
$204,155
Interest Rate
3.61%
Mortgage Type
New Conventional
Create a Home Valuation Report for This Property
The Home Valuation Report is an in-depth analysis detailing your home's value as well as a comparison with similar homes in the area
Home Values in the Area
Average Home Value in this Area
Purchase History
| Date | Buyer | Sale Price | Title Company |
|---|---|---|---|
| Kelley Jon G | $232,000 | Burnet Title | |
| Chowdhury Sagar | $214,900 | Burnet Title |
Source: Public Records
Mortgage History
| Date | Status | Borrower | Loan Amount |
|---|---|---|---|
| Open | Kelley Jon G | $232,000 | |
| Previous Owner | Chowdhury Sagar | $204,155 |
Source: Public Records
Tax History Compared to Growth
Tax History
| Year | Tax Paid | Tax Assessment Tax Assessment Total Assessment is a certain percentage of the fair market value that is determined by local assessors to be the total taxable value of land and additions on the property. | Land | Improvement |
|---|---|---|---|---|
| 2024 | $4,322 | $320,100 | $55,000 | $265,100 |
| 2023 | $3,710 | $299,500 | $55,000 | $244,500 |
| 2022 | $3,154 | $295,700 | $55,000 | $240,700 |
| 2021 | $3,026 | $242,500 | $35,000 | $207,500 |
| 2020 | $3,046 | $233,500 | $35,000 | $198,500 |
| 2019 | $2,680 | $226,500 | $35,000 | $191,500 |
| 2018 | $2,479 | $203,500 | $28,800 | $174,700 |
| 2017 | $2,438 | $192,100 | $28,800 | $163,300 |
| 2016 | $2,280 | $163,700 | $25,600 | $138,100 |
| 2015 | $2,154 | $149,700 | $25,100 | $124,600 |
| 2014 | $2,086 | $151,300 | $25,200 | $126,100 |
| 2012 | -- | $150,000 | $25,146 | $124,854 |
Source: Public Records
Map
Nearby Homes
- 2590 Hawk Ridge Ct SE
- 2846 20th Ave SE
- 2441 22nd Ave SE
- 1609 29th St SE
- 2633 23rd Ave SE
- 2305 Pinestar Ln SE
- 2177 McQuillan Ct SE
- 1005 21st St SE
- 1945 Spruce Meadows Dr SE
- 1940 Spruce Meadows Dr SE
- 1916 9 1 2 Ave SE
- 2539 Stacy St SE
- 820 24th St SE
- 807 25th St SE
- 2599 Stacy St SE
- 3097 Tamarack Ln SE
- 2990 Pinewood Ridge Dr SE
- 965 17th St SE
- 1644 10th Ave SE
- 623 17 1 2 St SE
- 2477 20th Ave SE
- 2511 20th Ave SE
- 2471 20th Ave SE
- 2517 20th Ave SE
- 2504 19th Ave SE
- 2512 19th Ave SE
- 2002 25th St SE
- 2465 20th Ave SE
- 2003 25th St SE
- 2523 20th Ave SE
- 2008 25th St SE
- 2009 25th St SE
- 2420 19th Ave SE
- 2455 20th Ave SE
- 2602 19th Ave SE
- 2603 20th Ave SE
- 2004 24 1/2 Ln SE
- 2007 26th St SE
- 2014 25th St SE
- 2015 25th St SE