2505 Longcourt Cir SE Unit 6 Smyrna, GA 30080
Vinings NeighborhoodEstimated Value: $382,417 - $417,000
3
Beds
4
Baths
2,522
Sq Ft
$159/Sq Ft
Est. Value
About This Home
This home is located at 2505 Longcourt Cir SE Unit 6, Smyrna, GA 30080 and is currently estimated at $399,854, approximately $158 per square foot. 2505 Longcourt Cir SE Unit 6 is a home located in Cobb County with nearby schools including Nickajack Elementary School, Campbell Middle School, and Campbell High School.
Ownership History
Date
Name
Owned For
Owner Type
Purchase Details
Closed on
Feb 28, 2024
Sold by
Fuller Dominique K
Bought by
Colliersmith Carol
Current Estimated Value
Purchase Details
Closed on
Oct 31, 2017
Sold by
Grove Scott C
Bought by
Fuller Dominique K
Purchase Details
Closed on
Feb 4, 2016
Sold by
Grove Scott C
Bought by
Grove Scott C Grove Tracy and Trustees Of The Grove Family Rev Tr
Purchase Details
Closed on
Oct 26, 2001
Sold by
Lessig Leslie L
Bought by
Grove Scott C
Home Financials for this Owner
Home Financials are based on the most recent Mortgage that was taken out on this home.
Original Mortgage
$174,000
Interest Rate
5.88%
Mortgage Type
New Conventional
Purchase Details
Closed on
Jul 31, 2000
Sold by
D R Horton Inc
Bought by
Lessig Leslie L
Home Financials for this Owner
Home Financials are based on the most recent Mortgage that was taken out on this home.
Original Mortgage
$111,150
Interest Rate
8.17%
Mortgage Type
New Conventional
Create a Home Valuation Report for This Property
The Home Valuation Report is an in-depth analysis detailing your home's value as well as a comparison with similar homes in the area
Home Values in the Area
Average Home Value in this Area
Purchase History
| Date | Buyer | Sale Price | Title Company |
|---|---|---|---|
| Colliersmith Carol | $360,000 | None Listed On Document | |
| Fuller Dominique K | $239,900 | -- | |
| Grove Scott C Grove Tracy | -- | -- | |
| Grove Scott C | $217,500 | -- | |
| Lessig Leslie L | $201,200 | -- |
Source: Public Records
Mortgage History
| Date | Status | Borrower | Loan Amount |
|---|---|---|---|
| Previous Owner | Grove Scott C | $174,000 | |
| Previous Owner | Lessig Leslie L | $111,150 |
Source: Public Records
Tax History Compared to Growth
Tax History
| Year | Tax Paid | Tax Assessment Tax Assessment Total Assessment is a certain percentage of the fair market value that is determined by local assessors to be the total taxable value of land and additions on the property. | Land | Improvement |
|---|---|---|---|---|
| 2024 | $4,874 | $161,652 | $44,000 | $117,652 |
| 2023 | $4,513 | $149,676 | $22,800 | $126,876 |
| 2022 | $3,983 | $131,224 | $22,800 | $108,424 |
| 2021 | $3,420 | $112,700 | $22,800 | $89,900 |
| 2020 | $2,954 | $97,322 | $20,520 | $76,802 |
| 2019 | $3,282 | $108,136 | $22,800 | $85,336 |
| 2018 | $2,697 | $88,856 | $22,800 | $66,056 |
| 2017 | $2,555 | $88,856 | $22,800 | $66,056 |
| 2016 | $2,414 | $83,952 | $21,200 | $62,752 |
| 2015 | $2,042 | $69,304 | $20,000 | $49,304 |
| 2014 | $2,059 | $69,304 | $0 | $0 |
Source: Public Records
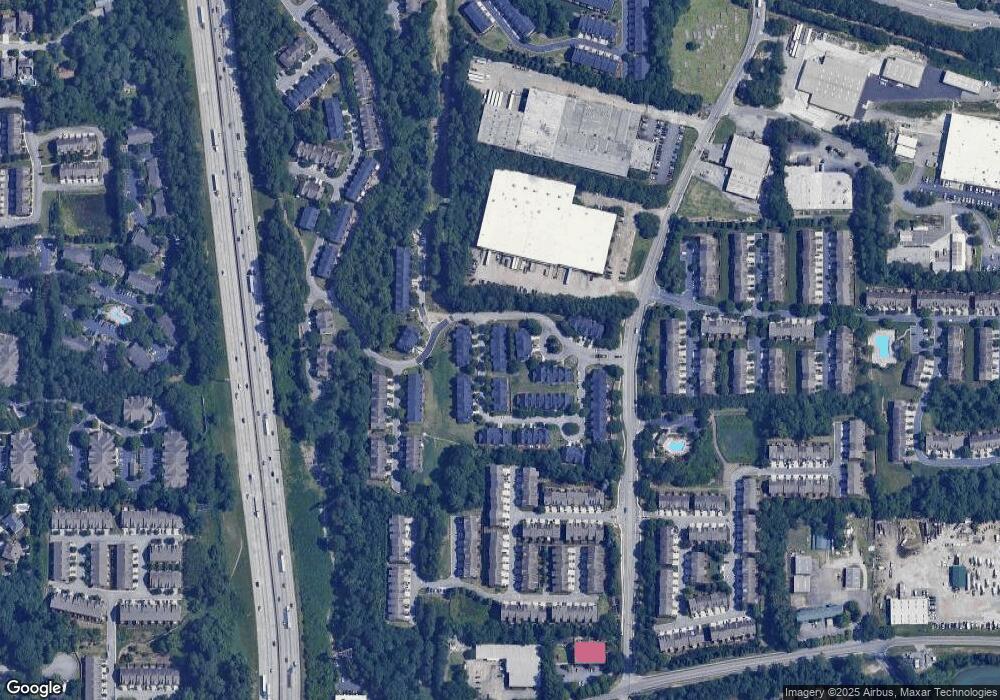
Map
Nearby Homes
- 5045 Ridgemont Walk Unit 28
- 4773 Longcourt Dr
- 2353 Maplewood Ct SE Unit 25
- 4866 Payson Terrace SE Unit 2
- 2428 Bridlewood Dr Unit 24
- 4855 Payson Terrace SE Unit 3
- 2396 Whiteoak Bend SE Unit 16
- 2388 Whiteoak Bend Unit 16
- 4892 Colchester Ct
- 5008 Whiteoak Pointe SE Unit 15
- 4888 Colchester Ct SE Unit 163
- 4965 Whiteoak Walk SE Unit 19
- 2335 Portrush Way (Lot 26) Dr
- 3895 Old Atlanta Station Dr SE Unit 1
- 5061 Bright Hampton Dr SE
- 2335 Millhaven St SE
- 2310 Portrush Way SE
- 2313 Millhaven St SE
- 2507 Longcourt Cir
- 2501 Longcourt Cir
- 2507 Longcourt Cir Unit 6
- 2501 Longcourt Cir Unit 6
- 2503 Longcourt Cir SE Unit 6
- 2501 Longcourt Cir SE Unit 6
- 2503 Longcourt Cir SE
- 2505 Longcourt Cir SE
- 2507 Longcourt Cir SE Unit 6
- 2509 Longcourt Cir SE Unit 6
- 2503 Longcourt Cir SE
- 2503 Longcourt Cir SE Unit 6
- 2505 Longcourt Cir Unit 6
- 2509 Longcourt Cir Unit 6
- 4820 Longcourt Dr SE Unit 2
- 2511 Longcourt Cir SE Unit 7
- 4816 Longcourt Dr SE Unit 2
- 2502 Longcourt Cir SE
- 4818 Longcourt Dr SE Unit 2
- 4818 Longcourt Dr SE Unit 4818