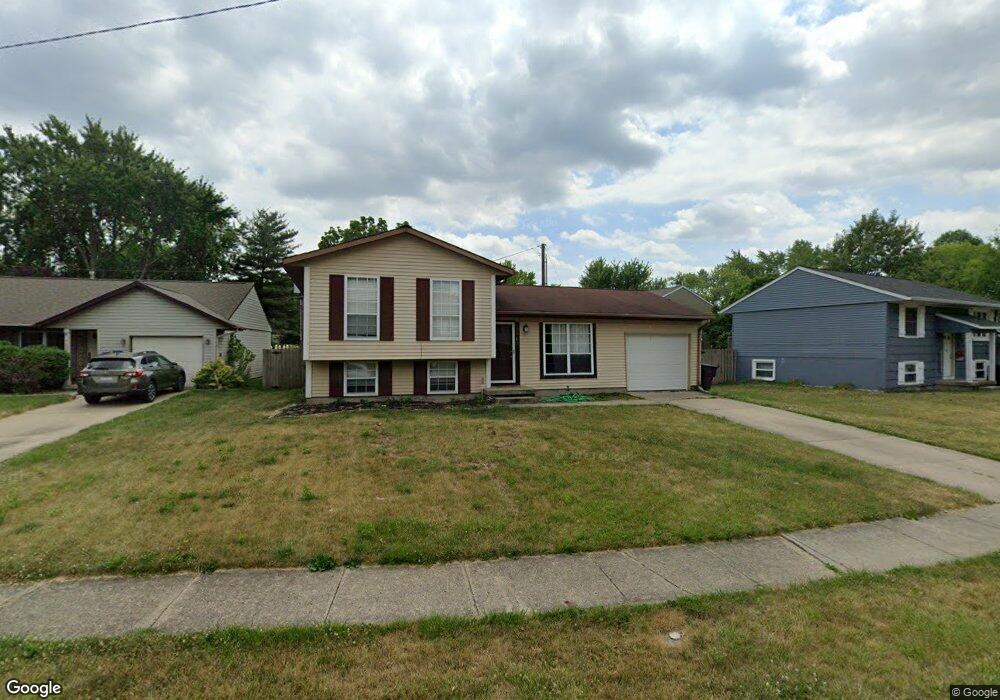
2505 Regent Ct Lafayette, IN 47909
Brady Lane NeighborhoodEstimated Value: $207,731 - $245,000
3
Beds
2
Baths
288
Sq Ft
$790/Sq Ft
Est. Value
About This Home
This home is located at 2505 Regent Ct, Lafayette, IN 47909 and is currently estimated at $227,433, approximately $789 per square foot. 2505 Regent Ct is a home located in Tippecanoe County with nearby schools including Edgelea Elementary School, Lafayette Tecumseh Junior High School, and Sunnyside Intermediate School.
Ownership History
Date
Name
Owned For
Owner Type
Purchase Details
Closed on
Nov 20, 2014
Sold by
Jarrard Gloria
Bought by
Kick Off Llc
Current Estimated Value
Purchase Details
Closed on
Mar 28, 2011
Sold by
Secretary Of Housing & Urban Development
Bought by
Jarrard Gloria
Purchase Details
Closed on
Sep 21, 2010
Sold by
Chase Home Finance Llc
Bought by
Secretary Of Housing & Urban Development
Purchase Details
Closed on
Jul 13, 2010
Sold by
Hershberger Thomas Edwin
Bought by
Chase Home Finance Llc
Create a Home Valuation Report for This Property
The Home Valuation Report is an in-depth analysis detailing your home's value as well as a comparison with similar homes in the area
Home Values in the Area
Average Home Value in this Area
Purchase History
| Date | Buyer | Sale Price | Title Company |
|---|---|---|---|
| Kick Off Llc | -- | -- | |
| Jarrard Gloria | -- | None Available | |
| Secretary Of Housing & Urban Development | -- | None Available | |
| Chase Home Finance Llc | $81,155 | None Available |
Source: Public Records
Tax History Compared to Growth
Tax History
| Year | Tax Paid | Tax Assessment Tax Assessment Total Assessment is a certain percentage of the fair market value that is determined by local assessors to be the total taxable value of land and additions on the property. | Land | Improvement |
|---|---|---|---|---|
| 2024 | $2,887 | $143,400 | $15,000 | $128,400 |
| 2023 | $2,871 | $143,300 | $15,000 | $128,300 |
| 2022 | $2,613 | $130,300 | $15,000 | $115,300 |
| 2021 | $2,335 | $116,300 | $15,000 | $101,300 |
| 2020 | $2,176 | $107,600 | $15,000 | $92,600 |
| 2019 | $2,095 | $103,500 | $15,000 | $88,500 |
| 2018 | $2,021 | $99,800 | $15,000 | $84,800 |
| 2017 | $2,001 | $99,300 | $15,000 | $84,300 |
| 2016 | $1,925 | $95,500 | $15,000 | $80,500 |
| 2014 | $1,768 | $88,400 | $15,000 | $73,400 |
| 2013 | $2,002 | $100,100 | $15,000 | $85,100 |
Source: Public Records
Map
Nearby Homes
- 2654 Brady Ln
- 3314 Pickwick Ct
- 120 Coldbrook Dr
- 3041 Commanche Trail
- 2408 Yuma Dr
- 3131 Brady Ln
- 1907 Griffon Dr
- 1801 Bengal Place
- 3320 Norwegian Dr
- 2200 Winterset Dr
- 1512 Sherwood Dr
- 2516 Oswego Ln
- 3244 Walton St
- 40 East Ct
- 1401 Normandy Dr
- 2303 Ottawa Dr
- 1303 Rochelle Dr
- 1405 Rochelle Dr
- 1301 Norma Jean Dr
- 2776 Medford St
- 2509 Regent Ct
- 2501 Regent Ct
- 3241 Commanche Trail
- 3245 Commanche Trail
- 3245 Commanche Trail
- 2513 Regent Ct
- 3482 Chaucer Dr
- 2504 Regent Ct
- 2500 Regent Ct
- 2508 Regent Ct
- 3478 Chaucer Dr
- 3486 Chaucer Dr
- 2517 Regent Ct
- 3225 Commanche Trail
- 2516 Regent Ct
- 3236 Commanche Trail
- 3240 Commanche Trail
- 2512 Regent Ct
- 3232 Commanche Trail
- 3474 Chaucer Dr