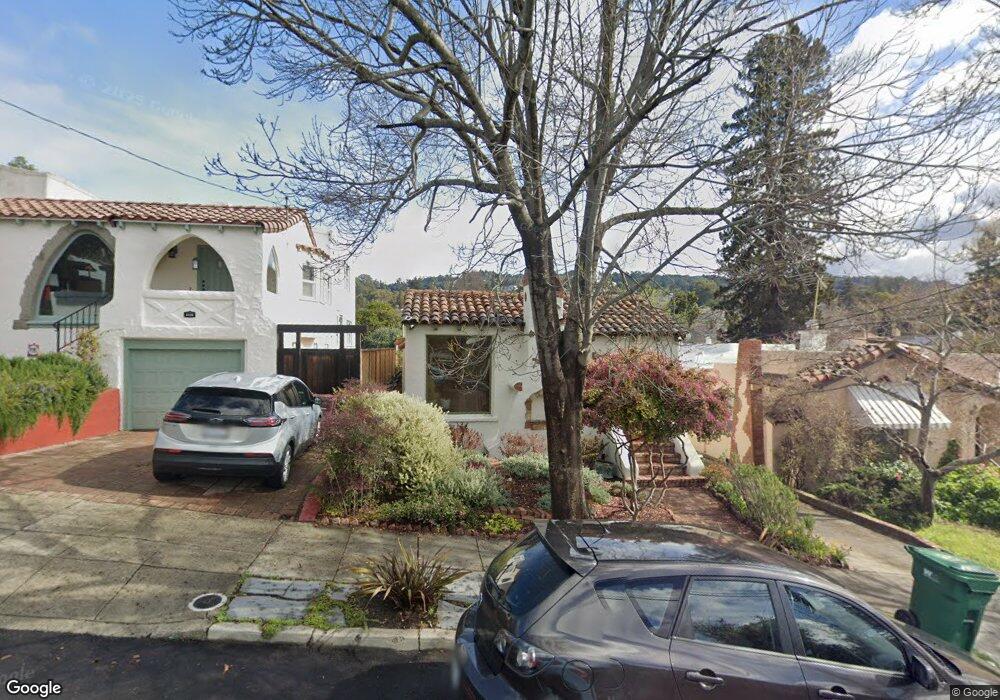
2506 Delmer St Oakland, CA 94602
Dimond District NeighborhoodEstimated Value: $876,461 - $1,281,000
2
Beds
1
Bath
1,185
Sq Ft
$879/Sq Ft
Est. Value
About This Home
This home is located at 2506 Delmer St, Oakland, CA 94602 and is currently estimated at $1,042,115, approximately $879 per square foot. 2506 Delmer St is a home located in Alameda County with nearby schools including Sequoia Elementary School, Bret Harte Middle School, and Skyline High School.
Ownership History
Date
Name
Owned For
Owner Type
Purchase Details
Closed on
Dec 5, 2018
Sold by
Kunhardt Tom and Lindberg Helen
Bought by
Kunhardt Thomas M and Lindberg Helen L
Current Estimated Value
Purchase Details
Closed on
Nov 15, 2012
Sold by
Bernavich Jeffery
Bought by
Kunhardt Tom and Lindberg Helen
Home Financials for this Owner
Home Financials are based on the most recent Mortgage that was taken out on this home.
Original Mortgage
$325,000
Outstanding Balance
$224,155
Interest Rate
3.35%
Mortgage Type
New Conventional
Estimated Equity
$817,960
Purchase Details
Closed on
Aug 1, 1999
Sold by
Baldwin Charles G
Bought by
Bernavich Jeffery
Purchase Details
Closed on
May 5, 1994
Sold by
Cann Gary G
Bought by
Bernavich Jeffery and Baldwin Charles G
Home Financials for this Owner
Home Financials are based on the most recent Mortgage that was taken out on this home.
Original Mortgage
$171,000
Interest Rate
4.25%
Create a Home Valuation Report for This Property
The Home Valuation Report is an in-depth analysis detailing your home's value as well as a comparison with similar homes in the area
Home Values in the Area
Average Home Value in this Area
Purchase History
| Date | Buyer | Sale Price | Title Company |
|---|---|---|---|
| Kunhardt Thomas M | -- | None Available | |
| Kunhardt Tom | $580,000 | Old Republic Title Company | |
| Bernavich Jeffery | $5,000 | -- | |
| Bernavich Jeffery | $190,000 | Old Republic Title Company |
Source: Public Records
Mortgage History
| Date | Status | Borrower | Loan Amount |
|---|---|---|---|
| Open | Kunhardt Tom | $325,000 | |
| Previous Owner | Bernavich Jeffery | $171,000 |
Source: Public Records
Tax History Compared to Growth
Tax History
| Year | Tax Paid | Tax Assessment Tax Assessment Total Assessment is a certain percentage of the fair market value that is determined by local assessors to be the total taxable value of land and additions on the property. | Land | Improvement |
|---|---|---|---|---|
| 2025 | $9,635 | $630,317 | $305,912 | $331,405 |
| 2024 | $9,635 | $617,825 | $299,916 | $324,909 |
| 2023 | $10,107 | $612,575 | $294,036 | $318,539 |
| 2022 | $9,841 | $593,565 | $288,271 | $312,294 |
| 2021 | $9,410 | $581,792 | $282,620 | $306,172 |
| 2020 | $9,307 | $582,759 | $279,724 | $303,035 |
| 2019 | $8,958 | $571,337 | $274,242 | $297,095 |
| 2018 | $8,771 | $560,138 | $268,866 | $291,272 |
| 2017 | $8,436 | $549,158 | $263,596 | $285,562 |
| 2016 | $8,158 | $538,390 | $258,427 | $279,963 |
| 2015 | $8,115 | $530,307 | $254,547 | $275,760 |
| 2014 | $8,219 | $519,919 | $249,561 | $270,358 |
Source: Public Records
Map
Nearby Homes
- 2510 Delmer St
- 3853 Rhoda Ave
- 3826 Lincoln Ave
- 2436 Potomac St
- 3875 Coolidge Ave
- 3873 Coolidge Ave
- 2726 Madeline St
- 2471 Burlington St
- 2808 Carmel St
- 4019 Rhoda Ave
- 3887 Forest Hill Ave
- 3847 Fruitvale Ave
- 4224 Lincoln Ave
- 2941 Madeline St
- 2715 Macarthur Blvd
- 3477 Boston Ave Unit 4
- 4271 Whittle Ave
- 2240 Macarthur Blvd
- 2958 Georgia St