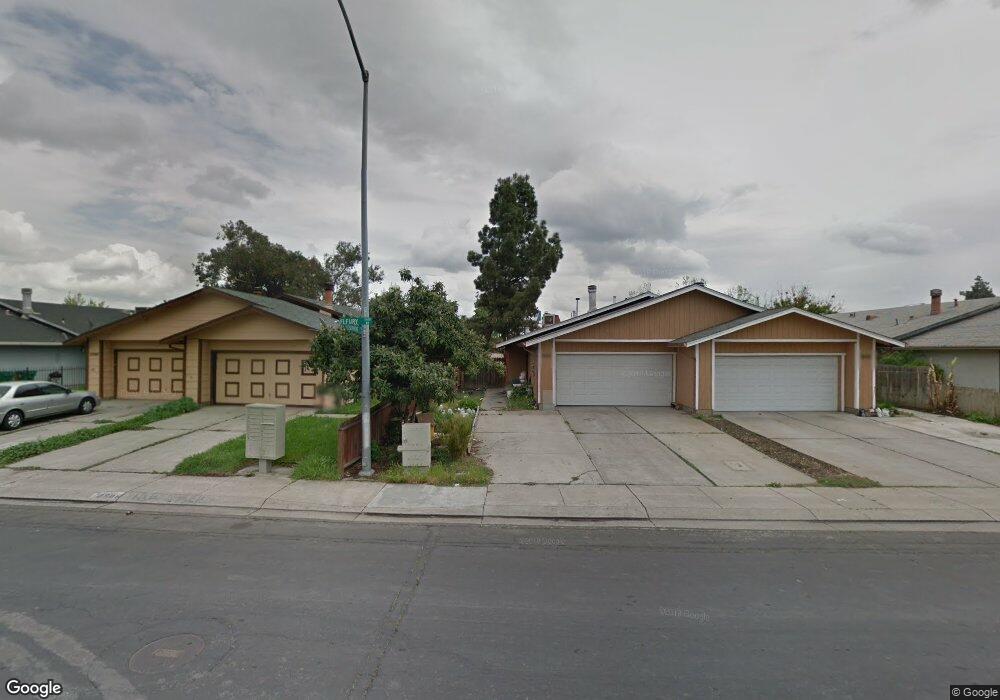
2506 Fleury Way Unit 2 Stockton, CA 95210
Valley Oak NeighborhoodEstimated Value: $358,000 - $474,000
5
Beds
3
Baths
1,940
Sq Ft
$225/Sq Ft
Est. Value
About This Home
This home is located at 2506 Fleury Way Unit 2, Stockton, CA 95210 and is currently estimated at $437,289, approximately $225 per square foot. 2506 Fleury Way Unit 2 is a home located in San Joaquin County with nearby schools including Clairmont Elementary School, Morada Middle School, and Ronald E. McNair High School.
Ownership History
Date
Name
Owned For
Owner Type
Purchase Details
Closed on
Oct 26, 2022
Sold by
Than Choeng and Chhen Song
Bought by
Chhen-Choeng Trust
Current Estimated Value
Purchase Details
Closed on
Feb 11, 2019
Sold by
Bautista Carol E
Bought by
Song Fa Chhen and Than Choeng
Home Financials for this Owner
Home Financials are based on the most recent Mortgage that was taken out on this home.
Original Mortgage
$185,000
Interest Rate
4.5%
Mortgage Type
Seller Take Back
Purchase Details
Closed on
Apr 25, 2017
Sold by
Atienza Clodualdo A and Atienza Alice G
Bought by
Bautista Carol E
Purchase Details
Closed on
Feb 2, 2000
Sold by
Gabriana Erlinda D and Atienza Clodualdo A
Bought by
Atienza Clodualdo A and Atienza Alicia G
Purchase Details
Closed on
Mar 31, 1997
Sold by
Atienza Clodualdo A
Bought by
Gabriana Erlinda D and Atienza Clodualdo A
Create a Home Valuation Report for This Property
The Home Valuation Report is an in-depth analysis detailing your home's value as well as a comparison with similar homes in the area
Home Values in the Area
Average Home Value in this Area
Purchase History
| Date | Buyer | Sale Price | Title Company |
|---|---|---|---|
| Chhen-Choeng Trust | -- | -- | |
| Song Fa Chhen | $255,000 | Chicago Title Company Stockt | |
| Bautista Carol E | $237,000 | Chicago Title Company | |
| Atienza Clodualdo A | -- | -- | |
| Gabriana Erlinda D | -- | -- |
Source: Public Records
Mortgage History
| Date | Status | Borrower | Loan Amount |
|---|---|---|---|
| Previous Owner | Song Fa Chhen | $185,000 |
Source: Public Records
Tax History Compared to Growth
Tax History
| Year | Tax Paid | Tax Assessment Tax Assessment Total Assessment is a certain percentage of the fair market value that is determined by local assessors to be the total taxable value of land and additions on the property. | Land | Improvement |
|---|---|---|---|---|
| 2025 | $3,693 | $327,957 | $89,238 | $238,719 |
| 2024 | $3,625 | $321,528 | $87,489 | $234,039 |
| 2023 | $3,584 | $315,224 | $85,774 | $229,450 |
| 2022 | $3,506 | $309,044 | $84,093 | $224,951 |
| 2021 | $3,588 | $302,986 | $82,445 | $220,541 |
| 2020 | $3,502 | $299,880 | $81,600 | $218,280 |
| 2019 | $2,876 | $246,574 | $72,828 | $173,746 |
| 2018 | $3,544 | $241,740 | $71,400 | $170,340 |
| 2017 | $1,856 | $158,299 | $37,310 | $120,989 |
| 2016 | $1,749 | $155,197 | $36,579 | $118,618 |
| 2014 | $1,725 | $95,000 | $23,000 | $72,000 |
Source: Public Records
Map
Nearby Homes
- 8007 Lorraine Ave
- 8107 8107 Grenoble Way
- 8110 Rouen Ct
- 7127 Tristan Cir Unit 10
- 7238 Sharkon Ln
- 7112 Tristan Cir
- 7028 Tristan Cir
- 1926 Shameran St
- 1657 Knickerbocker Dr
- 8153 Moulin Ct
- 1864 Caleb Cir
- 8600 West Ln Unit 154
- 8600 West Ln Unit 116
- 8600 West Ln Unit 68
- 8600 West Ln Unit 92
- 8600 West Ln Unit 172
- 8600 West Ln Unit 76
- 8837 Fox Creek Dr Unit 1
- 1537 Pyrenees Ave Unit 21
- 1545 Pyrenees Ave Unit 27
- 2506 Fleury Way
- 2514 Fleury Way
- 2420 Fleury Way
- 2414 Fleury Way
- 2526 Fleury Way
- 2509 Fleury Way
- 8009 Champagne Dr
- 2408 Fleury Way
- 2517 Fleury Way
- 2525 Fleury Way
- 8017 Champagne Dr
- 2402 Fleury Way
- 2405 Fleury Way
- 8018 Burgundy Dr
- 8030 Champagne Dr
- 8025 Champagne Dr
- 8008 Bernay Dr
- 8035 Burgundy Dr
- 8014 Bernay Dr
- 8032 Burgundy Dr