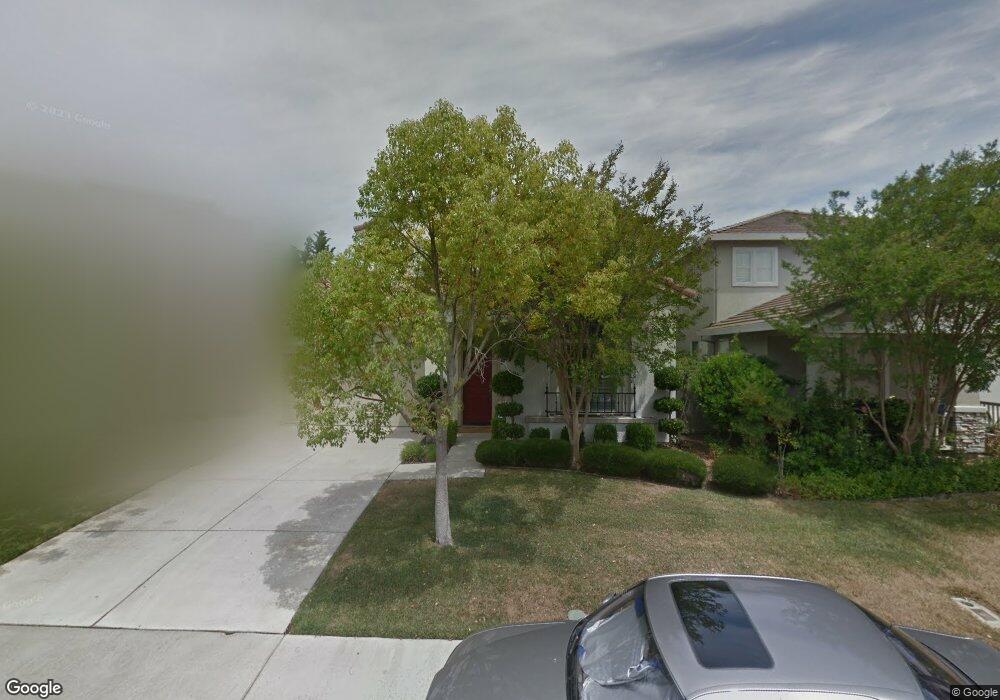
2507 Rock Dove Way Elk Grove, CA 95757
North West Elk Grove NeighborhoodEstimated Value: $283,000 - $698,784
3
Beds
2
Baths
2,367
Sq Ft
$248/Sq Ft
Est. Value
About This Home
This home is located at 2507 Rock Dove Way, Elk Grove, CA 95757 and is currently estimated at $587,196, approximately $248 per square foot. 2507 Rock Dove Way is a home located in Sacramento County with nearby schools including Elliott Ranch Elementary School, Elizabeth Pinkerton Middle School, and Cosumnes Oaks High School.
Ownership History
Date
Name
Owned For
Owner Type
Purchase Details
Closed on
Nov 10, 2016
Sold by
Tsai Patrick and Tsai Sheryl Christina
Bought by
Tsai Patrick and Tsai Sheryl C
Current Estimated Value
Purchase Details
Closed on
Jul 26, 2011
Sold by
Butcher Laurie K and Butcher David J
Bought by
Tsai Patrick and Tsai Sheryl Christina
Home Financials for this Owner
Home Financials are based on the most recent Mortgage that was taken out on this home.
Original Mortgage
$110,000
Outstanding Balance
$9,029
Interest Rate
4.46%
Mortgage Type
New Conventional
Estimated Equity
$578,167
Purchase Details
Closed on
Jul 22, 2006
Sold by
Butcher Laurie K and Butcher David J
Bought by
Butcher Laurie K and Butcher David J
Purchase Details
Closed on
Apr 4, 2002
Sold by
Morrison Homes Inc
Bought by
Butcher David J and Butcher Laurie K
Home Financials for this Owner
Home Financials are based on the most recent Mortgage that was taken out on this home.
Original Mortgage
$238,900
Interest Rate
6.78%
Create a Home Valuation Report for This Property
The Home Valuation Report is an in-depth analysis detailing your home's value as well as a comparison with similar homes in the area
Home Values in the Area
Average Home Value in this Area
Purchase History
| Date | Buyer | Sale Price | Title Company |
|---|---|---|---|
| Tsai Patrick | -- | None Available | |
| Tsai Patrick | $265,000 | North American Title Company | |
| Butcher Laurie K | -- | None Available | |
| Butcher David J | $299,000 | First American Title Co |
Source: Public Records
Mortgage History
| Date | Status | Borrower | Loan Amount |
|---|---|---|---|
| Open | Tsai Patrick | $110,000 | |
| Previous Owner | Butcher David J | $238,900 | |
| Closed | Butcher David J | $29,800 |
Source: Public Records
Tax History Compared to Growth
Tax History
| Year | Tax Paid | Tax Assessment Tax Assessment Total Assessment is a certain percentage of the fair market value that is determined by local assessors to be the total taxable value of land and additions on the property. | Land | Improvement |
|---|---|---|---|---|
| 2025 | $4,267 | $332,841 | $125,599 | $207,242 |
| 2024 | $4,267 | $326,316 | $123,137 | $203,179 |
| 2023 | $4,304 | $319,919 | $120,723 | $199,196 |
| 2022 | $4,241 | $313,647 | $118,356 | $195,291 |
| 2021 | $4,170 | $307,498 | $116,036 | $191,462 |
| 2020 | $4,126 | $304,346 | $114,847 | $189,499 |
| 2019 | $4,052 | $298,380 | $112,596 | $185,784 |
| 2018 | $3,958 | $292,531 | $110,389 | $182,142 |
| 2017 | $3,886 | $286,796 | $108,225 | $178,571 |
| 2016 | $3,730 | $281,173 | $106,103 | $175,070 |
| 2015 | $3,663 | $276,951 | $104,510 | $172,441 |
| 2014 | $3,617 | $271,527 | $102,463 | $169,064 |
Source: Public Records
Map
Nearby Homes
- 2413 Mckeon Way
- 9809 W Taron Dr
- 9736 Harrier Way
- 2624 W Pintail Way
- 2500 Merlin Way
- 3120 E Pintail Way
- 3005 Turnbuckle Cir
- 2807 Turnbuckle Cir
- 3305 Turnbuckle Cir
- 9431 Sea Cliff Way
- 9653 Sea Cliff Way
- 3009 Granite Park Ln
- 9608 Crystal Bay Ln
- 2720 Robinson Creek Ln Unit L
- 3403 Lakeland Way
- 3112 W Sondiesa Ct
- 9544 Lakewind Ln
- 3016 W Sondiesa Ct
- 3430 Sierra Meadow Ct
- 3619 Lake Terrace Dr
- 2511 Rock Dove Way
- 2503 Rock Dove Way
- 9845 Nature Trail Way
- 2515 Rock Dove Way
- 9841 Nature Trail Way
- 9816 Harrier Place
- 2508 Rock Dove Way
- 2504 Rock Dove Way
- 9812 Harrier Way
- 2512 Rock Dove Way
- 2521 Rock Dove Way
- 2429 Rock Dove Way
- 2500 Rock Dove Way
- 9837 Nature Trail Way
- 2516 Rock Dove Way
- 9844 Nature Trail Way
- 2432 Rock Dove Way
- 9820 Harrier Place
- 9820 Harrier Way
- 2525 Rock Dove Way Unit 9