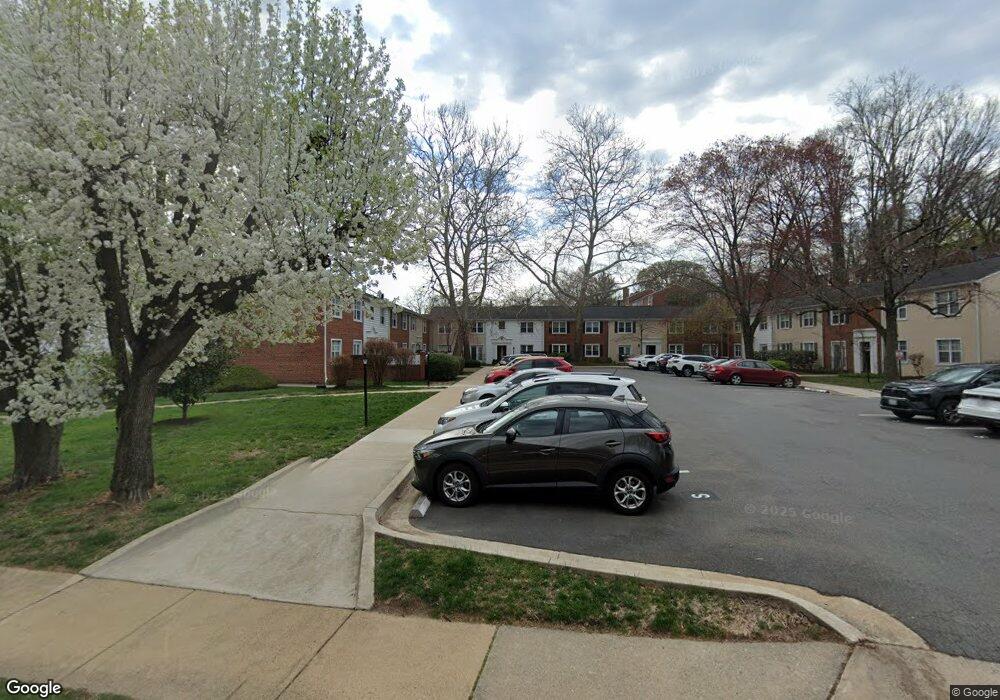
2507 S Walter Reed Dr Unit D Arlington, VA 22206
Fairlington NeighborhoodEstimated Value: $409,025 - $413,000
2
Beds
1
Bath
800
Sq Ft
$513/Sq Ft
Est. Value
About This Home
This home is located at 2507 S Walter Reed Dr Unit D, Arlington, VA 22206 and is currently estimated at $410,756, approximately $513 per square foot. 2507 S Walter Reed Dr Unit D is a home located in Arlington County with nearby schools including Abingdon Elementary School, Gunston Middle School, and Wakefield High School.
Ownership History
Date
Name
Owned For
Owner Type
Purchase Details
Closed on
Oct 19, 2017
Sold by
Weiner Brian
Bought by
Holcombe Elizabeth A
Current Estimated Value
Home Financials for this Owner
Home Financials are based on the most recent Mortgage that was taken out on this home.
Original Mortgage
$288,000
Outstanding Balance
$240,626
Interest Rate
3.83%
Mortgage Type
New Conventional
Estimated Equity
$170,130
Purchase Details
Closed on
Aug 9, 2012
Sold by
Stanga Stephanie A
Bought by
Weiner Brian
Home Financials for this Owner
Home Financials are based on the most recent Mortgage that was taken out on this home.
Original Mortgage
$265,410
Interest Rate
3.67%
Mortgage Type
New Conventional
Purchase Details
Closed on
Nov 29, 1999
Sold by
Scott Sharon E
Bought by
Ibe Uche
Home Financials for this Owner
Home Financials are based on the most recent Mortgage that was taken out on this home.
Original Mortgage
$97,950
Interest Rate
7.77%
Create a Home Valuation Report for This Property
The Home Valuation Report is an in-depth analysis detailing your home's value as well as a comparison with similar homes in the area
Home Values in the Area
Average Home Value in this Area
Purchase History
| Date | Buyer | Sale Price | Title Company |
|---|---|---|---|
| Holcombe Elizabeth A | $320,000 | -- | |
| Weiner Brian | $294,900 | -- | |
| Ibe Uche | $101,000 | -- |
Source: Public Records
Mortgage History
| Date | Status | Borrower | Loan Amount |
|---|---|---|---|
| Open | Holcombe Elizabeth A | $288,000 | |
| Previous Owner | Weiner Brian | $265,410 | |
| Previous Owner | Ibe Uche | $97,950 |
Source: Public Records
Tax History Compared to Growth
Tax History
| Year | Tax Paid | Tax Assessment Tax Assessment Total Assessment is a certain percentage of the fair market value that is determined by local assessors to be the total taxable value of land and additions on the property. | Land | Improvement |
|---|---|---|---|---|
| 2025 | $3,953 | $382,700 | $61,600 | $321,100 |
| 2024 | $3,888 | $376,400 | $61,600 | $314,800 |
| 2023 | $3,694 | $358,600 | $61,600 | $297,000 |
| 2022 | $3,694 | $358,600 | $61,600 | $297,000 |
| 2021 | $3,634 | $352,800 | $61,600 | $291,200 |
| 2020 | $3,398 | $331,200 | $41,600 | $289,600 |
| 2019 | $3,128 | $304,900 | $41,600 | $263,300 |
| 2018 | $2,942 | $292,400 | $41,600 | $250,800 |
| 2017 | $2,799 | $278,200 | $41,600 | $236,600 |
| 2016 | $2,781 | $280,600 | $41,600 | $239,000 |
| 2015 | $2,844 | $285,500 | $41,600 | $243,900 |
| 2014 | $2,796 | $280,700 | $41,600 | $239,100 |
Source: Public Records
Map
Nearby Homes
- 2505 S Walter Reed Dr Unit A
- 4617 28th Rd S Unit B
- 4619 28th Rd S Unit B
- 4619 28th Rd S Unit C
- 2540 S Walter Reed Dr Unit 4
- 4614 28th Rd S Unit B
- 4519 28th Rd S Unit A
- 2605 S Walter Reed Dr Unit A
- 2907 S Woodley St Unit C
- 2432 S Culpeper St
- 2592 G S Arlington Mill Dr Unit 7
- 4163 S Four Mile Run Dr Unit 301
- 2246 S Randolph St Unit 1
- 2842 S Columbus St
- 5041 25th St S
- 4113 S Four Mile Run Dr Unit 404
- 4600 30th Rd S
- 2949 S Columbus St Unit A2
- 2100 S Quebec St
- 4127 S Four Mile Run Dr Unit 304
- 2507 S Walter Reed Dr Unit C
- 2507 S Walter Reed Dr Unit A
- 2507 S Walter Reed Dr Unit D
- 2507 S Walter Reed Dr Unit B
- 2507 S Walter Reed Dr Unit C
- 2507 S Walter Reed Dr Unit A
- 2507 S Walter Reed Dr
- 2507 S Walter Reed Dr Unit B
- 2507 S Walter Reed Dr Unit C
- 2507 Walter Reed Drive D S Unit D
- 2507 D S Walter Reed Dr
- 2505 C S Walter Reed Dr Unit C
- 2509 S Walter Reed Dr Unit A
- 2509 S Walter Reed Dr Unit B
- 2509 S Walter Reed Dr Unit D
- 2509 S Walter Reed Dr Unit C
- 2509 S Walter Reed Dr Unit A
- 2509 S Walter Reed Dr Unit D
- 2509 S Walter Reed Dr Unit D
- 2509 S Walter Reed Dr Unit C