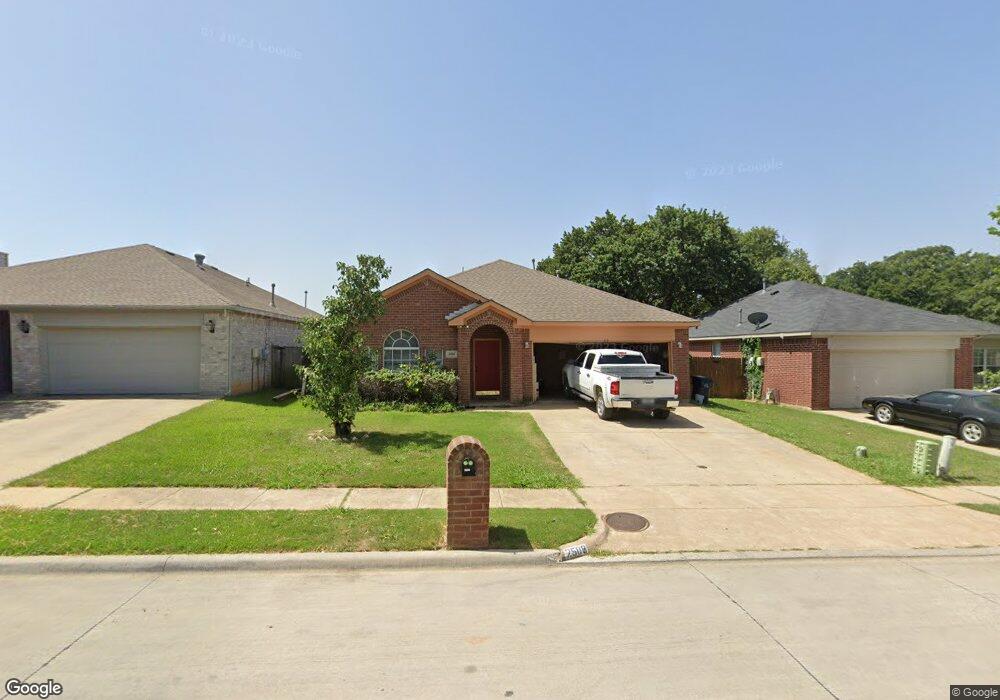
2508 Fondren Rd Denton, TX 76210
South Denton NeighborhoodEstimated Value: $319,000 - $358,000
3
Beds
2
Baths
1,770
Sq Ft
$189/Sq Ft
Est. Value
About This Home
This home is located at 2508 Fondren Rd, Denton, TX 76210 and is currently estimated at $334,765, approximately $189 per square foot. 2508 Fondren Rd is a home located in Denton County with nearby schools including Nelson Elementary School, McMath Middle School, and Denton High School.
Ownership History
Date
Name
Owned For
Owner Type
Purchase Details
Closed on
Dec 2, 2003
Sold by
Bank One Na
Bought by
James Anthony and Sydney Gloria H
Current Estimated Value
Home Financials for this Owner
Home Financials are based on the most recent Mortgage that was taken out on this home.
Original Mortgage
$110,000
Interest Rate
6.01%
Mortgage Type
Purchase Money Mortgage
Purchase Details
Closed on
May 6, 2003
Sold by
Mortgage Electronic Registration Systems
Bought by
Bank One Na
Purchase Details
Closed on
Nov 13, 2000
Sold by
Choice Homes Inc
Bought by
Seger Craig and Seger Susan
Home Financials for this Owner
Home Financials are based on the most recent Mortgage that was taken out on this home.
Original Mortgage
$125,300
Interest Rate
7.9%
Purchase Details
Closed on
Aug 16, 2000
Sold by
Harley Associates Ltd
Bought by
Choice Homes Inc
Create a Home Valuation Report for This Property
The Home Valuation Report is an in-depth analysis detailing your home's value as well as a comparison with similar homes in the area
Home Values in the Area
Average Home Value in this Area
Purchase History
| Date | Buyer | Sale Price | Title Company |
|---|---|---|---|
| James Anthony | -- | -- | |
| Bank One Na | -- | -- | |
| Mortgage Electronic Registration Systems | $127,500 | -- | |
| Bank One Na | -- | -- | |
| Mortgage Electronic Registration Systems | $127,500 | -- | |
| Seger Craig | -- | -- | |
| Choice Homes Inc | -- | -- | |
| Choice Homes Inc | -- | -- |
Source: Public Records
Mortgage History
| Date | Status | Borrower | Loan Amount |
|---|---|---|---|
| Closed | James Anthony | $110,000 | |
| Previous Owner | Seger Craig | $125,300 |
Source: Public Records
Tax History Compared to Growth
Tax History
| Year | Tax Paid | Tax Assessment Tax Assessment Total Assessment is a certain percentage of the fair market value that is determined by local assessors to be the total taxable value of land and additions on the property. | Land | Improvement |
|---|---|---|---|---|
| 2025 | $6,138 | $302,000 | $85,658 | $216,342 |
| 2024 | $6,138 | $318,000 | $85,658 | $232,342 |
| 2023 | $5,957 | $339,978 | $85,658 | $254,320 |
| 2022 | $5,688 | $267,961 | $67,538 | $200,423 |
| 2021 | $5,537 | $249,085 | $46,123 | $202,962 |
| 2020 | $5,039 | $220,470 | $46,123 | $174,347 |
| 2019 | $5,288 | $221,603 | $46,123 | $175,480 |
| 2018 | $4,833 | $200,088 | $46,123 | $153,965 |
| 2017 | $4,692 | $189,809 | $39,534 | $150,275 |
| 2016 | $4,585 | $175,495 | $39,534 | $135,961 |
| 2015 | $3,692 | $157,836 | $39,534 | $118,302 |
| 2014 | $3,692 | $147,563 | $39,534 | $108,029 |
| 2013 | -- | $129,875 | $39,534 | $90,341 |
Source: Public Records
Map
Nearby Homes
- 3900 Gessner Dr
- 2617 Bissonet Dr
- 2616 Hilcroft Ave
- 2713 Hilcroft Ave
- 3933 Parkhaven Dr
- 2121 Corsair Ln
- 2617 Hollow Ridge Dr
- 3812 Gennaker Dr
- 2804 Hollow Ridge Dr
- 2412 Miranda Place
- 2617 Hereford Rd
- 2817 Hereford Rd
- Pizarro Plan at
- Kingsley Plan at
- 4017 Whisperwood Rd
- Addison Plan at
- 2721 Arabian Ave
- 2601 Pinto Dr
- 3448 Tuscan Hills Cir
- 3237 Clydesdale Dr
- 2504 Fondren Rd
- 2512 Fondren Rd
- 2516 Fondren Rd
- 2520 Fondren Rd
- 2509 Fondren Rd
- 2600 Fondren Rd
- 2513 Fondren Rd
- 2505 Fondren Rd
- 2517 Fondren Rd
- 2501 Fondren Rd
- 2604 Fondren Rd
- 2409 Fondren Rd
- 2609 Fondren Rd
- 2508 Westheimer Rd
- 2512 Westheimer Rd
- 2608 Fondren Rd
- 2405 Fondren Rd
- 2504 Westheimer Rd
- 2516 Westheimer Rd
- 2600 Westheimer Rd