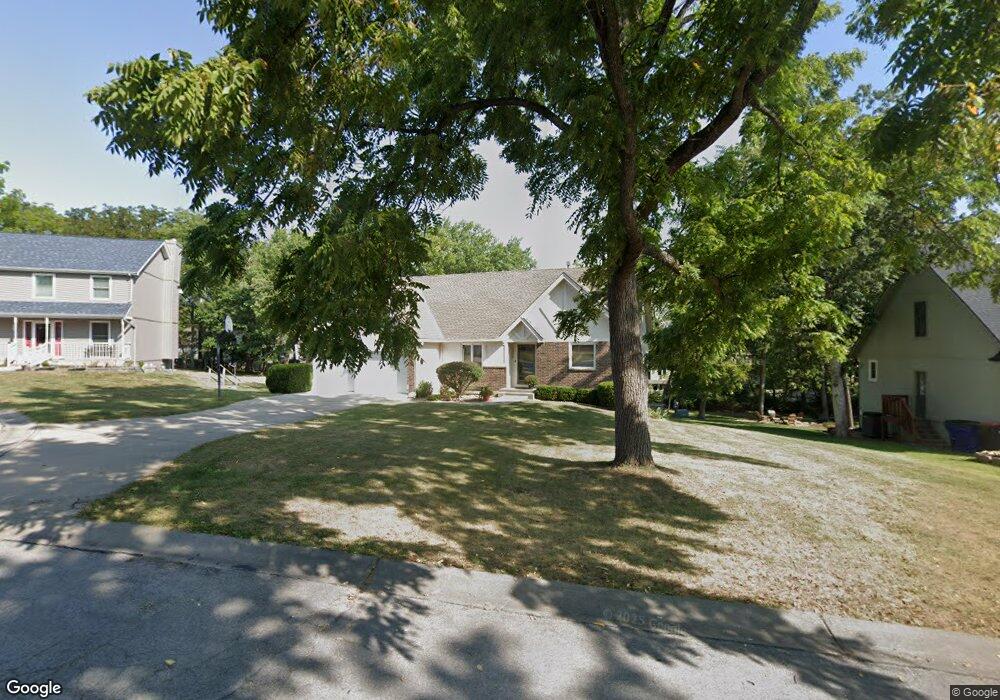
2508 NW Shady Bend Ln Lees Summit, MO 64081
Estimated Value: $388,000 - $432,000
3
Beds
4
Baths
2,151
Sq Ft
$188/Sq Ft
Est. Value
About This Home
This home is located at 2508 NW Shady Bend Ln, Lees Summit, MO 64081 and is currently estimated at $404,046, approximately $187 per square foot. 2508 NW Shady Bend Ln is a home located in Jackson County with nearby schools including Cedar Creek Elementary School, Bernard C. Campbell Middle School, and Lee's Summit North High School.
Ownership History
Date
Name
Owned For
Owner Type
Purchase Details
Closed on
Nov 12, 2004
Sold by
Federal Home Loan Mortgage Assn
Bought by
Hathcock James W and Hathcock Rebecca S
Current Estimated Value
Home Financials for this Owner
Home Financials are based on the most recent Mortgage that was taken out on this home.
Original Mortgage
$142,400
Outstanding Balance
$64,936
Interest Rate
4.5%
Mortgage Type
Purchase Money Mortgage
Estimated Equity
$339,110
Purchase Details
Closed on
Apr 23, 2004
Sold by
Wells Fargo Home Mortgage Inc
Bought by
Federal Home Loan Mortgage Corporation
Purchase Details
Closed on
Apr 21, 2004
Sold by
Adkins Thomas E and Adkins Ann E
Bought by
Wells Fargo Home Mortgage Inc
Create a Home Valuation Report for This Property
The Home Valuation Report is an in-depth analysis detailing your home's value as well as a comparison with similar homes in the area
Home Values in the Area
Average Home Value in this Area
Purchase History
| Date | Buyer | Sale Price | Title Company |
|---|---|---|---|
| Hathcock James W | -- | First American Title Ins Co | |
| Federal Home Loan Mortgage Corporation | -- | First Financial Title Of Kan | |
| Wells Fargo Home Mortgage Inc | $181,012 | First Financial Title Of Kan |
Source: Public Records
Mortgage History
| Date | Status | Borrower | Loan Amount |
|---|---|---|---|
| Open | Hathcock James W | $142,400 |
Source: Public Records
Tax History Compared to Growth
Tax History
| Year | Tax Paid | Tax Assessment Tax Assessment Total Assessment is a certain percentage of the fair market value that is determined by local assessors to be the total taxable value of land and additions on the property. | Land | Improvement |
|---|---|---|---|---|
| 2025 | $3,498 | $55,717 | $13,849 | $41,868 |
| 2024 | $3,473 | $48,450 | $6,426 | $42,024 |
| 2023 | $3,473 | $48,450 | $7,959 | $40,491 |
| 2022 | $4,172 | $51,680 | $5,941 | $45,739 |
| 2021 | $4,258 | $51,680 | $5,941 | $45,739 |
| 2020 | $4,296 | $51,631 | $5,941 | $45,690 |
| 2019 | $4,179 | $51,631 | $5,941 | $45,690 |
| 2018 | $3,919 | $44,936 | $5,171 | $39,765 |
| 2017 | $3,919 | $44,936 | $5,171 | $39,765 |
| 2016 | $3,797 | $43,092 | $8,189 | $34,903 |
| 2014 | $3,698 | $41,146 | $7,645 | $33,501 |
Source: Public Records
Map
Nearby Homes
- 2501 NW Shady Bend Ln
- 2503 NW Windwood Dr
- 2536 NW Bent Tree Cir
- 2616 NW Lookout Ridge
- 2508 NW Bent Tree Cir
- 813 NW High Point Dr
- 2257 NW Summerfield Dr
- 932 NW Bent Tree Dr
- 130 NW Ambersham Dr
- 505 NW Ambersham Dr
- 2007 NW Chipman Rd
- 2122 NW Ashurst Dr
- 928 NW Cedar Creek Ln
- 1031 NW Cedar Creek Ln
- 2110 NW Ashurst Dr
- 361 NW Patch Ct
- 2090 NW O'Brien Rd
- 2214 NW Killarney Ln
- 2082 NW O'Brien Rd
- 2086 NW O'Brien Rd
- 2512 NW Shady Bend Ln
- 2504 NW Shady Bend Ln
- 2516 NW Shady Bend Ln
- 2521 NW Overbrook Dr
- 2500 NW Shady Bend Ln
- 2525 NW Overbrook Dr
- 2505 NW Shady Bend Ln
- 2517 NW Overbrook Dr
- 2529 NW Overbrook Dr
- 2513 NW Overbrook Dr
- 2448 NW Shady Bend Ln
- 2506 NW Windwood Dr
- 2509 NW Overbrook Dr
- 811 NW Game Creek
- 2502 NW Windwood Dr
- 2510 NW Windwood Dr
- 2447 NW Shady Bend Ln
- 2444 NW Shady Bend Ln
- 2508 NW Overbrook Dr
- 2605 NW Bent Tree Cir