Estimated Value: $214,677 - $340,000
3
Beds
2
Baths
1,227
Sq Ft
$204/Sq Ft
Est. Value
About This Home
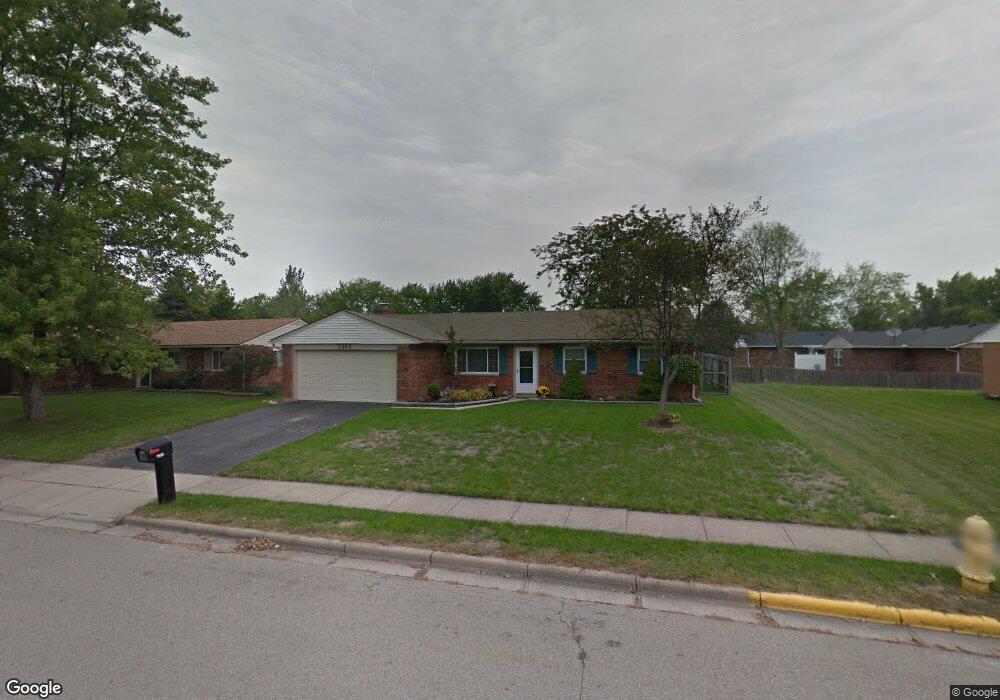
This home is located at 2509 Inverness Ct, Troy, OH 45373 and is currently estimated at $249,919, approximately $203 per square foot. 2509 Inverness Ct is a home located in Miami County with nearby schools including Hook Elementary School, Troy Junior High School, and Van Cleve Elementary School.
Ownership History
Date
Name
Owned For
Owner Type
Purchase Details
Closed on
May 9, 2014
Sold by
Hines Colt L
Bought by
Mamitag Marvin M and Mamitag Maria Blesilda A
Current Estimated Value
Home Financials for this Owner
Home Financials are based on the most recent Mortgage that was taken out on this home.
Original Mortgage
$113,858
Outstanding Balance
$86,086
Interest Rate
4.12%
Mortgage Type
FHA
Estimated Equity
$163,833
Purchase Details
Closed on
Oct 10, 2012
Sold by
Poeppelman Brian P and Poeppelman Cheryl L
Bought by
Harlow Frank D and Harlow Holly L
Home Financials for this Owner
Home Financials are based on the most recent Mortgage that was taken out on this home.
Original Mortgage
$82,450
Interest Rate
3.57%
Mortgage Type
Purchase Money Mortgage
Purchase Details
Closed on
Jul 18, 2005
Sold by
Pogue Robert M and Pogue Megan M
Bought by
Poeppelman Brian P and Poeppelman Cheryl L
Purchase Details
Closed on
Aug 23, 1994
Sold by
Arguello Roger
Bought by
Pogue Robert M and Pogue Megan M
Create a Home Valuation Report for This Property
The Home Valuation Report is an in-depth analysis detailing your home's value as well as a comparison with similar homes in the area
Home Values in the Area
Average Home Value in this Area
Purchase History
| Date | Buyer | Sale Price | Title Company |
|---|---|---|---|
| Mamitag Marvin M | $116,000 | Attorney | |
| Harlow Frank D | $105,000 | None Available | |
| Poeppelman Brian P | $118,000 | -- | |
| Pogue Robert M | $83,500 | -- |
Source: Public Records
Mortgage History
| Date | Status | Borrower | Loan Amount |
|---|---|---|---|
| Open | Mamitag Marvin M | $113,858 | |
| Previous Owner | Harlow Frank D | $82,450 | |
| Closed | Pogue Robert M | -- |
Source: Public Records
Tax History Compared to Growth
Tax History
| Year | Tax Paid | Tax Assessment Tax Assessment Total Assessment is a certain percentage of the fair market value that is determined by local assessors to be the total taxable value of land and additions on the property. | Land | Improvement |
|---|---|---|---|---|
| 2024 | $2,019 | $53,550 | $11,270 | $42,280 |
| 2023 | $2,019 | $53,550 | $11,270 | $42,280 |
| 2022 | $1,681 | $53,550 | $11,270 | $42,280 |
| 2021 | $1,264 | $38,260 | $8,050 | $30,210 |
| 2020 | $1,266 | $38,260 | $8,050 | $30,210 |
| 2019 | $1,278 | $38,260 | $8,050 | $30,210 |
| 2018 | $1,138 | $32,800 | $8,370 | $24,430 |
| 2017 | $1,150 | $32,800 | $8,370 | $24,430 |
| 2016 | $1,132 | $32,800 | $8,370 | $24,430 |
| 2015 | $1,136 | $31,540 | $8,050 | $23,490 |
| 2014 | $1,136 | $31,540 | $8,050 | $23,490 |
| 2013 | $1,176 | $31,540 | $8,050 | $23,490 |
Source: Public Records
Map
Nearby Homes
- 2513 Glenmore Ct
- 2511 Glenmore Ct
- 2722-2724 Fairview Ct
- 2600 Meadowpoint Dr
- 2455 Lupine Ct
- 2791 Meadowpoint Dr
- 2365 Murphy Ln W
- 2290 Murphy Ln E
- 2430 Coriander Ct
- 1645 Cornish Rd
- 622 Windsor Rd
- 1601 Henley Rd
- 1248 Waterbury Place
- 1144 Red Maple Dr
- 3318 Heatherstone Dr
- 1395 Covent Rd
- 2261 Lytle Rd
- 2267 Lytle Rd
- 143 S Dorset Rd
- 2273 Lytle Rd
- 2511 Inverness Ct
- 2507 Inverness Ct
- 2402 New Castle Dr
- 2512 Galway Ct
- 2514 Galway Ct
- 2513 Inverness Ct
- 2510 Galway Ct
- 2512 Inverness Ct
- 2516 Galway Ct
- 2514 Inverness Ct
- 2510 Inverness Ct
- 2516 Inverness Ct
- 2515 Inverness Ct
- 2518 Galway Ct
- 2508 Inverness Ct
- 2401 New Castle Dr
- 2518 Inverness Ct
- 2403 New Castle Dr
- 2506 Inverness Ct
- 2520 Galway Ct