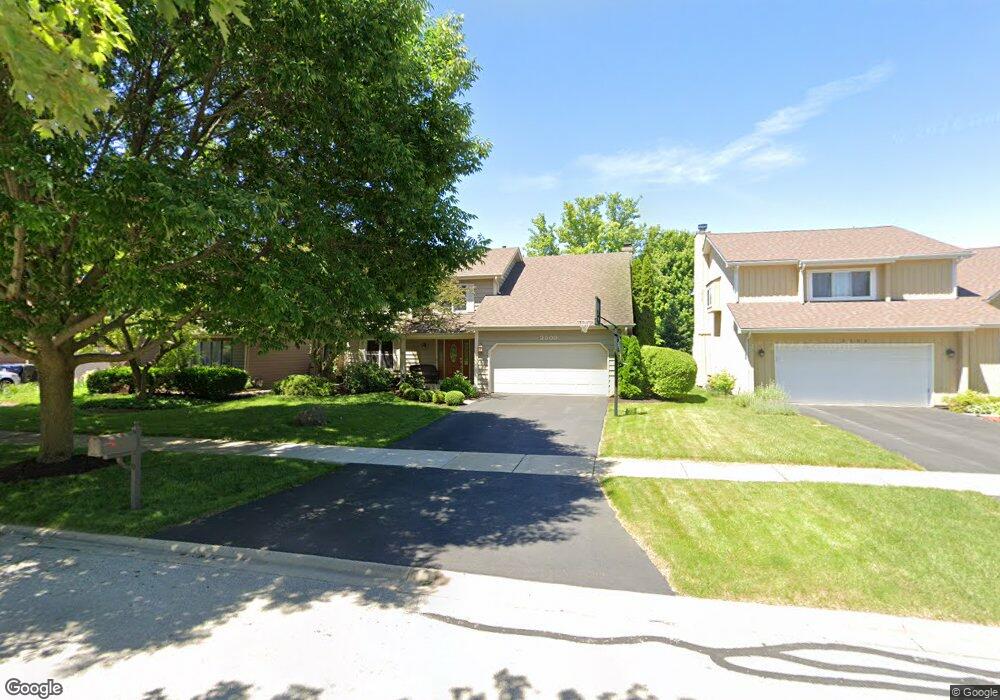
2509 Leach Dr Naperville, IL 60564
Springbrook Prairie NeighborhoodEstimated Value: $546,306 - $618,000
--
Bed
1
Bath
2,394
Sq Ft
$243/Sq Ft
Est. Value
About This Home
This home is located at 2509 Leach Dr, Naperville, IL 60564 and is currently estimated at $581,327, approximately $242 per square foot. 2509 Leach Dr is a home located in Will County with nearby schools including Robert Clow Elementary School, Ellsworth Elementary School, and Gordon Gregory Middle School.
Ownership History
Date
Name
Owned For
Owner Type
Purchase Details
Closed on
May 31, 2024
Sold by
Piraino Frank and Piraino Robin D
Bought by
Piraino Family Trust and Piraino
Current Estimated Value
Purchase Details
Closed on
Oct 19, 2001
Sold by
Saulnier Michael W and Saulnier Diane J
Bought by
Piraino Frank and Piraino Robin D
Home Financials for this Owner
Home Financials are based on the most recent Mortgage that was taken out on this home.
Original Mortgage
$200,000
Interest Rate
6.69%
Purchase Details
Closed on
Oct 11, 2001
Sold by
Arteaga Elizabeth A
Bought by
Saulnier Michael W and Saulnier Diane J
Home Financials for this Owner
Home Financials are based on the most recent Mortgage that was taken out on this home.
Original Mortgage
$200,000
Interest Rate
6.69%
Create a Home Valuation Report for This Property
The Home Valuation Report is an in-depth analysis detailing your home's value as well as a comparison with similar homes in the area
Home Values in the Area
Average Home Value in this Area
Purchase History
| Date | Buyer | Sale Price | Title Company |
|---|---|---|---|
| Piraino Family Trust | -- | None Listed On Document | |
| Piraino Frank | $309,000 | Stewart Title Company | |
| Saulnier Michael W | $539,000 | First American Title |
Source: Public Records
Mortgage History
| Date | Status | Borrower | Loan Amount |
|---|---|---|---|
| Previous Owner | Piraino Frank | $200,000 | |
| Previous Owner | Saulnier Michael W | $339,000 | |
| Closed | Piraino Frank | $60,000 |
Source: Public Records
Tax History Compared to Growth
Tax History
| Year | Tax Paid | Tax Assessment Tax Assessment Total Assessment is a certain percentage of the fair market value that is determined by local assessors to be the total taxable value of land and additions on the property. | Land | Improvement |
|---|---|---|---|---|
| 2024 | $10,134 | $162,715 | $36,274 | $126,441 |
| 2023 | $10,134 | $143,741 | $32,044 | $111,697 |
| 2022 | $9,648 | $134,764 | $30,312 | $104,452 |
| 2021 | $8,912 | $128,347 | $28,869 | $99,478 |
| 2020 | $8,741 | $126,314 | $28,412 | $97,902 |
| 2019 | $8,588 | $122,754 | $27,611 | $95,143 |
| 2018 | $8,491 | $119,353 | $27,003 | $92,350 |
| 2017 | $8,359 | $116,272 | $26,306 | $89,966 |
| 2016 | $8,341 | $113,769 | $25,740 | $88,029 |
| 2015 | $8,592 | $109,393 | $24,750 | $84,643 |
| 2014 | $8,592 | $108,741 | $24,750 | $83,991 |
| 2013 | $8,592 | $108,741 | $24,750 | $83,991 |
Source: Public Records
Map
Nearby Homes
- 1134 Gateshead Dr
- 1305 Morningstar Ct Unit 1A
- 1329 Neskola Ct
- 1321 Galena Ct
- 2224 Flambeau Dr
- 2301 Mecan Dr
- 2741 Gateshead Dr
- 28W555 Leverenz Rd
- 1300 Leawood Ct
- 2636 Salix Cir
- 1123 Thackery Ln
- 567 Roxbury Dr
- 584 Beaconsfield Ave
- 3004 Bennett Dr
- 2949 Brossman St
- 2737 Seiler Dr
- 3212 Austin Ct
- 2206 Gleneagles Dr
- 945 Winners Cup Ct Unit 945
- 1116 Hollingswood Ave