Estimated Value: $174,979 - $229,000
--
Bed
1
Bath
1,382
Sq Ft
$143/Sq Ft
Est. Value
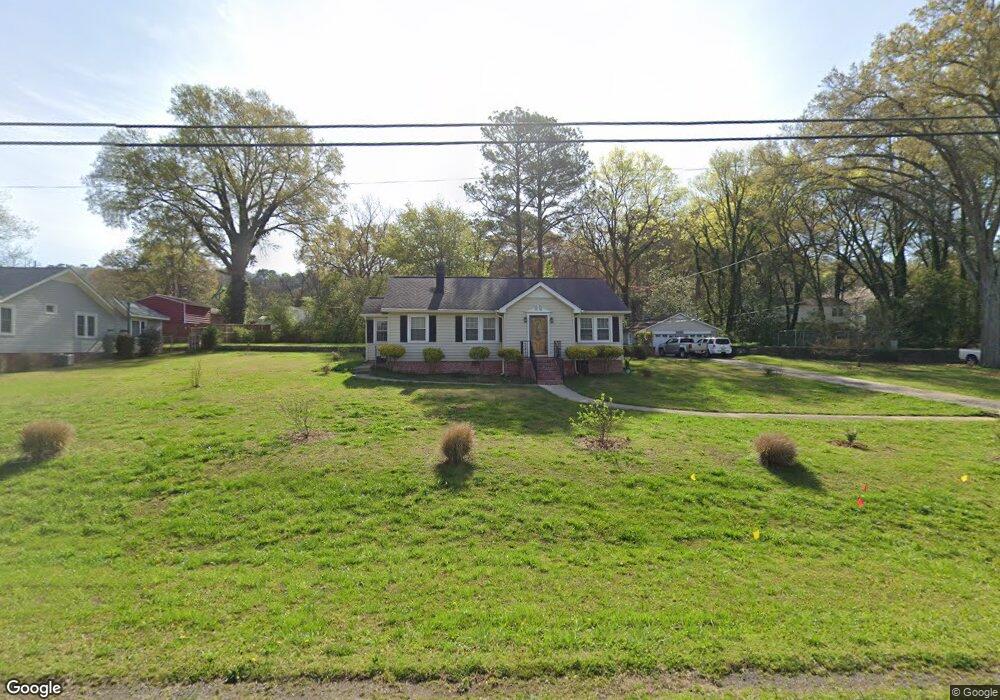
About This Home
This home is located at 2509 Maple Rd SE, Rome, GA 30161 and is currently estimated at $197,995, approximately $143 per square foot. 2509 Maple Rd SE is a home located in Floyd County with nearby schools including Pepperell Middle School, Pepperell High School, and Montessori School of Rome.
Ownership History
Date
Name
Owned For
Owner Type
Purchase Details
Closed on
Nov 20, 1995
Sold by
Knott David A and Knott Patrice S
Bought by
Knott Patrice S
Current Estimated Value
Purchase Details
Closed on
May 16, 1990
Sold by
Knott David A Knott David A Knott Da
Bought by
Knott David A and Knott Patrice S
Purchase Details
Closed on
Oct 1, 1976
Sold by
P\R P\R P\R
Bought by
Knott David A Knott David A Knott D
Purchase Details
Closed on
Aug 23, 1976
Sold by
P\R P\R P\R
Bought by
P\R P\R P\R
Purchase Details
Closed on
Aug 20, 1976
Sold by
Leithauser Don G Leithauser Don G Leitha
Bought by
P\R P\R P\R
Purchase Details
Closed on
May 19, 1976
Sold by
Farrer Wm Sidney Farrer Wm Sidney Far
Bought by
Leithauser Don G Leithauser Don G L
Purchase Details
Closed on
Jan 16, 1976
Sold by
P\R
Bought by
Farrer Wm Sidney Farrer Wm Sidney F
Purchase Details
Closed on
Jul 17, 1964
Sold by
P\R
Bought by
Farrer Bonnie
Purchase Details
Closed on
Feb 1, 1947
Bought by
Farrer William S Farrer William S F
Create a Home Valuation Report for This Property
The Home Valuation Report is an in-depth analysis detailing your home's value as well as a comparison with similar homes in the area
Home Values in the Area
Average Home Value in this Area
Purchase History
| Date | Buyer | Sale Price | Title Company |
|---|---|---|---|
| Knott Patrice S | $15,000 | -- | |
| Knott David A | -- | -- | |
| Knott David A Knott David A Knott D | $25,000 | -- | |
| P\R P\R P\R | -- | -- | |
| P\R P\R P\R | -- | -- | |
| Leithauser Don G Leithauser Don G L | $28,500 | -- | |
| Farrer Wm Sidney Farrer Wm Sidney F | -- | -- | |
| Farrer Bonnie | -- | -- | |
| P\R | -- | -- | |
| Farrer William S Farrer William S F | -- | -- |
Source: Public Records
Tax History
| Year | Tax Paid | Tax Assessment Tax Assessment Total Assessment is a certain percentage of the fair market value that is determined by local assessors to be the total taxable value of land and additions on the property. | Land | Improvement |
|---|---|---|---|---|
| 2025 | $1,086 | $78,269 | $17,701 | $60,568 |
| 2024 | $1,086 | $71,770 | $16,092 | $55,678 |
| 2023 | $1,002 | $67,540 | $14,304 | $53,236 |
| 2022 | $833 | $56,002 | $11,920 | $44,082 |
| 2021 | $761 | $51,425 | $11,920 | $39,505 |
| 2020 | $483 | $46,226 | $8,940 | $37,286 |
| 2019 | $427 | $43,972 | $8,940 | $35,032 |
| 2018 | $1,079 | $41,718 | $8,940 | $32,778 |
| 2017 | $1,057 | $40,414 | $8,940 | $31,474 |
| 2016 | $1,053 | $39,440 | $8,920 | $30,520 |
| 2015 | $998 | $39,480 | $8,920 | $30,560 |
| 2014 | $998 | $37,825 | $8,920 | $28,905 |
Source: Public Records
Map
Nearby Homes
- 2508 Maple Rd SE
- 2523 Maple Rd SE
- 2501 Maple Rd SE
- 212 Alfred Ave SE
- 2710 Maple Rd SE
- 0 Martha Berry Hwy Unit 7525627
- 0 Martha Berry Hwy Unit 7614774
- 0 Martha Berry Hwy Unit 10690106
- 0 Martha Berry Hwy Unit 10563404
- 36 Saddle Mountain Rd SE
- 27 Saddle Mountain Rd SE
- 2108 Maple Ave SW
- 2812 Maple Rd SE
- 7 Willingham St SW
- 2827 Maple Rd SE
- 2405 Rockmart Rd SE
- 26 Saddlebrook Dr SE
- 2107 Rockmart Rd SE
- 15 Saddlebrook Dr SE
- 118 Hosea St SW
- 2505 Maple Rd SE
- 8 Flora Ave SE
- 2503 Maple Rd SE
- 6 Flora Ave SE
- 2511 Maple Rd SE
- 10 Flora Ave SE
- 4 Flora Ave SE
- 2508 Maple Rd SE
- 2508 Maple Rd SE
- 12 Flora Ave SE
- 2506 Maple Rd SE
- 2517 Maple Rd SE
- 2510 Maple Rd SE
- 2502 Maple Rd SE
- 14 Flora Ave SE
- 102 Hawthorne St SE
- 2512 Maple Rd SE
- 7 Flora Ave SE
- 2519 Maple Rd SE
- 2429 Maple Rd SE
Your Personal Tour Guide
Ask me questions while you tour the home.