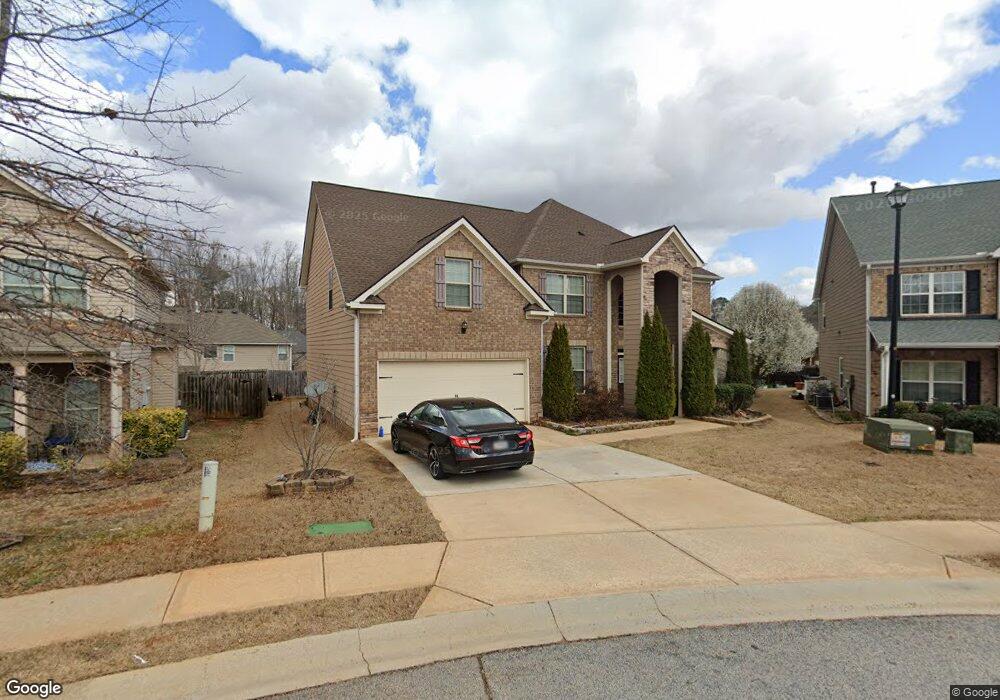
2509 Ruskin Ct Mc Donough, GA 30253
Estimated Value: $376,000 - $437,000
5
Beds
3
Baths
3,237
Sq Ft
$126/Sq Ft
Est. Value
About This Home
This home is located at 2509 Ruskin Ct, Mc Donough, GA 30253 and is currently estimated at $407,300, approximately $125 per square foot. 2509 Ruskin Ct is a home located in Henry County with nearby schools including Luella Elementary School, Luella Middle School, and Luella High School.
Ownership History
Date
Name
Owned For
Owner Type
Purchase Details
Closed on
Apr 28, 2017
Sold by
Rebecca Tercy
Bought by
Still Juquay
Current Estimated Value
Home Financials for this Owner
Home Financials are based on the most recent Mortgage that was taken out on this home.
Original Mortgage
$220,825
Outstanding Balance
$183,406
Interest Rate
4.14%
Mortgage Type
FHA
Estimated Equity
$223,894
Purchase Details
Closed on
Jan 26, 2015
Sold by
Century Communities Of Georgia
Bought by
Tercy Rebecca and Tercy Joseph Jeff-Audry
Home Financials for this Owner
Home Financials are based on the most recent Mortgage that was taken out on this home.
Original Mortgage
$201,276
Interest Rate
6.37%
Mortgage Type
FHA
Purchase Details
Closed on
Nov 1, 2014
Sold by
Peachtree Communities At Westr
Bought by
Century Communities Of Georgia
Purchase Details
Closed on
Apr 9, 2014
Sold by
Georgia 75 Retreat Llc
Bought by
Peachtree Communities At Westr
Create a Home Valuation Report for This Property
The Home Valuation Report is an in-depth analysis detailing your home's value as well as a comparison with similar homes in the area
Home Values in the Area
Average Home Value in this Area
Purchase History
| Date | Buyer | Sale Price | Title Company |
|---|---|---|---|
| Still Juquay | $224,900 | -- | |
| Tercy Rebecca | $204,990 | -- | |
| Century Communities Of Georgia | $1,226,028 | -- | |
| Peachtree Communities At Westr | $242,000 | -- |
Source: Public Records
Mortgage History
| Date | Status | Borrower | Loan Amount |
|---|---|---|---|
| Open | Still Juquay | $220,825 | |
| Previous Owner | Tercy Rebecca | $201,276 |
Source: Public Records
Tax History Compared to Growth
Tax History
| Year | Tax Paid | Tax Assessment Tax Assessment Total Assessment is a certain percentage of the fair market value that is determined by local assessors to be the total taxable value of land and additions on the property. | Land | Improvement |
|---|---|---|---|---|
| 2025 | $5,729 | $174,480 | $16,000 | $158,480 |
| 2024 | $5,729 | $163,960 | $16,000 | $147,960 |
| 2023 | $4,937 | $162,520 | $14,000 | $148,520 |
| 2022 | $4,770 | $122,640 | $14,000 | $108,640 |
| 2021 | $4,008 | $102,760 | $14,000 | $88,760 |
| 2020 | $4,005 | $102,680 | $10,000 | $92,680 |
| 2019 | $3,865 | $99,040 | $10,000 | $89,040 |
| 2018 | $3,517 | $89,960 | $12,414 | $77,546 |
| 2016 | $3,211 | $82,000 | $9,512 | $72,488 |
| 2015 | $3,451 | $85,600 | $8,800 | $76,800 |
| 2014 | $266 | $6,000 | $6,000 | $0 |
Source: Public Records
Map
Nearby Homes
- 1313 Jubilee Ln
- 2093 Parador Bend
- 1441 Trellis Ct
- 1441 Trellis Ct Unit (LOT 7)
- 2200 Highway 20 W
- 1533 Rolling Meadows Dr
- 461 Arbor Chase
- 276 Oakland Rd
- 400 Savannah Place
- 505 Stone Rd
- 203 Nail Dr
- 133 Nail Dr
- 15 Oak Hill Ct
- 491 Highway 81
- 1478 Elena Dr
- 344 Williamsburg Cir Unit 1
- 2026 Gates Ct
- 112 Bridget Dr
- 272 Stone Rd
- 1749 Misselthrush Ln
- 2513 Ruskin Ct
- 2505 Ruskin Ct Unit 269
- 2505 Ruskin Ct
- 2396 Braelin Loop
- 2392 Braelin Loop
- 2400 Braelin Loop
- 2400 Braelin Loop Unit 275
- 2400 Braelin Loop
- 2512 Ruskin Ct Unit 266
- 2512 Ruskin Ct
- 2380 Braelin Loop
- 2404 Braelin Loop Unit 276
- 2404 Braelin Loop
- 2428 Braelin Loop Unit 278
- 2428 Braelin Loop
- 2372 Braelin Loop
- 2432 Braelin Loop Unit 279
- 2432 Braelin Loop
- 2508 Ruskin Ct
- 2501 Ruskin Ct