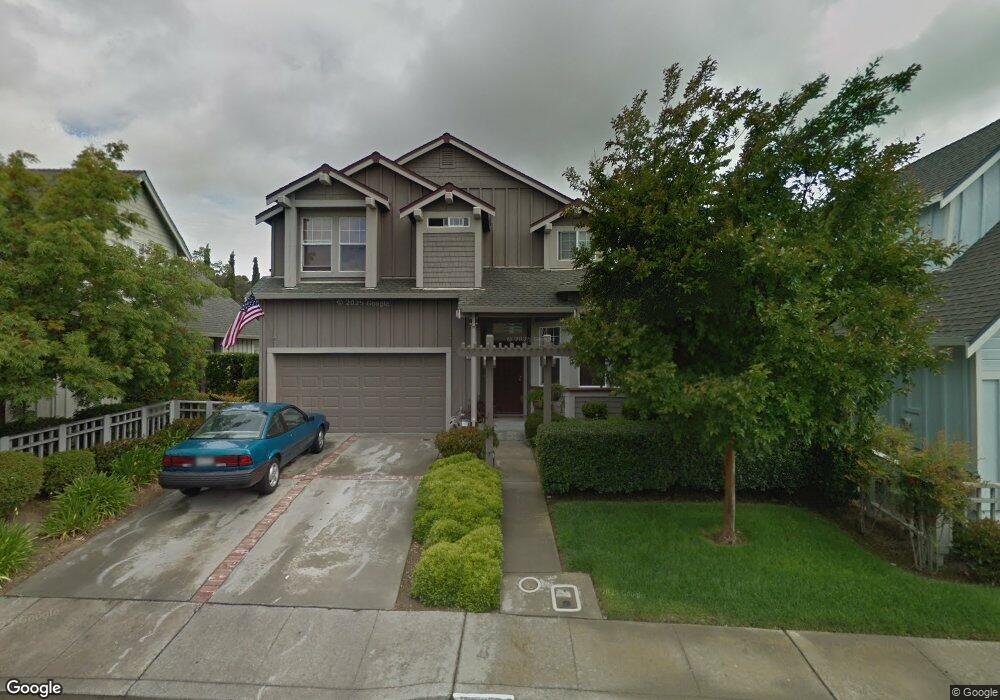
251 Cliff Walk Dr Vallejo, CA 94591
Glen Cove NeighborhoodEstimated Value: $680,000 - $811,000
4
Beds
3
Baths
2,099
Sq Ft
$347/Sq Ft
Est. Value
About This Home
This home is located at 251 Cliff Walk Dr, Vallejo, CA 94591 and is currently estimated at $728,937, approximately $347 per square foot. 251 Cliff Walk Dr is a home located in Solano County with nearby schools including Glen Cove Elementary, Jesse M. Bethel High School, and Vallejo Charter School.
Ownership History
Date
Name
Owned For
Owner Type
Purchase Details
Closed on
Aug 26, 2020
Sold by
Dockter Deborah
Bought by
Dockter Deborah Kaye and The Deborah Kaye Dockter Livin
Current Estimated Value
Purchase Details
Closed on
May 28, 2010
Sold by
Dockter Deborah and Dockter Deborah K
Bought by
Dockter Deborah
Home Financials for this Owner
Home Financials are based on the most recent Mortgage that was taken out on this home.
Original Mortgage
$209,000
Outstanding Balance
$140,484
Interest Rate
5.03%
Mortgage Type
New Conventional
Estimated Equity
$588,453
Purchase Details
Closed on
May 4, 1998
Sold by
Gco Associates Lp
Bought by
Dockter Douglas G and Dockter Deborah K
Home Financials for this Owner
Home Financials are based on the most recent Mortgage that was taken out on this home.
Original Mortgage
$187,200
Interest Rate
6.62%
Create a Home Valuation Report for This Property
The Home Valuation Report is an in-depth analysis detailing your home's value as well as a comparison with similar homes in the area
Home Values in the Area
Average Home Value in this Area
Purchase History
| Date | Buyer | Sale Price | Title Company |
|---|---|---|---|
| Dockter Deborah Kaye | -- | None Available | |
| Dockter Deborah | -- | Old Republic Title Company | |
| Dockter Douglas G | $208,000 | First American Title Guarant |
Source: Public Records
Mortgage History
| Date | Status | Borrower | Loan Amount |
|---|---|---|---|
| Open | Dockter Deborah | $209,000 | |
| Closed | Dockter Douglas G | $187,200 |
Source: Public Records
Tax History Compared to Growth
Tax History
| Year | Tax Paid | Tax Assessment Tax Assessment Total Assessment is a certain percentage of the fair market value that is determined by local assessors to be the total taxable value of land and additions on the property. | Land | Improvement |
|---|---|---|---|---|
| 2025 | $5,158 | $343,941 | $95,804 | $248,137 |
| 2024 | $5,158 | $337,198 | $93,926 | $243,272 |
| 2023 | $5,677 | $330,587 | $92,085 | $238,502 |
| 2022 | $5,579 | $324,106 | $90,280 | $233,826 |
| 2021 | $5,473 | $317,752 | $88,510 | $229,242 |
| 2020 | $5,494 | $314,495 | $87,603 | $226,892 |
| 2019 | $5,359 | $308,330 | $85,886 | $222,444 |
| 2018 | $5,023 | $302,285 | $84,202 | $218,083 |
| 2017 | $4,902 | $296,358 | $82,551 | $213,807 |
| 2016 | $4,328 | $290,548 | $80,933 | $209,615 |
| 2015 | $4,281 | $286,185 | $79,718 | $206,467 |
| 2014 | $4,135 | $280,580 | $78,157 | $202,423 |
Source: Public Records
Map
Nearby Homes
- 293 Cliff Walk Dr
- 106 Camino Del Sol
- 2012 Glen Cove Rd
- 153 Camino Del Sol
- 108 James River Rd
- 901 Point Reyes Ct Unit 1
- 611 Sea Ranch Ct Unit 6
- 911 Point Reyes Ct Unit 4
- 254 Clearview Dr
- 100 Shoal Dr W
- 201 James River Rd
- 7 Shoal Dr E Unit 1
- 28 Shoal Dr E
- 393 Starfish Dr
- 1201 Glen Cove Pkwy Unit 1809
- 1201 Glen Cove Pkwy Unit 514
- 1201 Glen Cove Pkwy Unit 602
- 1201 Glen Cove Pkwy Unit 1714
- 1201 Glen Cove Pkwy Unit 313
- 1201 Glen Cove Pkwy Unit 1001
- 245 Cliff Walk Dr
- 257 Cliff Walk Dr
- 263 Cliff Walk Dr
- 239 Cliff Walk Dr
- 248 Cliff Walk Dr
- 233 Cliff Walk Dr
- 269 Cliff Walk Dr
- 254 Cliff Walk Dr
- 230 Cliff Walk Dr
- 227 Cliff Walk Dr
- 275 Cliff Walk Dr
- 272 Cliff Walk Dr
- 221 Cliff Walk Dr
- 46 Narragansett Ct
- 52 Narragansett Ct
- 281 Cliff Walk Dr
- 284 Cliff Walk Dr
- 38 Narragansett Ct
- 58 Narragansett Ct