Estimated Value: $98,000 - $152,054
2
Beds
2
Baths
2,022
Sq Ft
$61/Sq Ft
Est. Value
About This Home
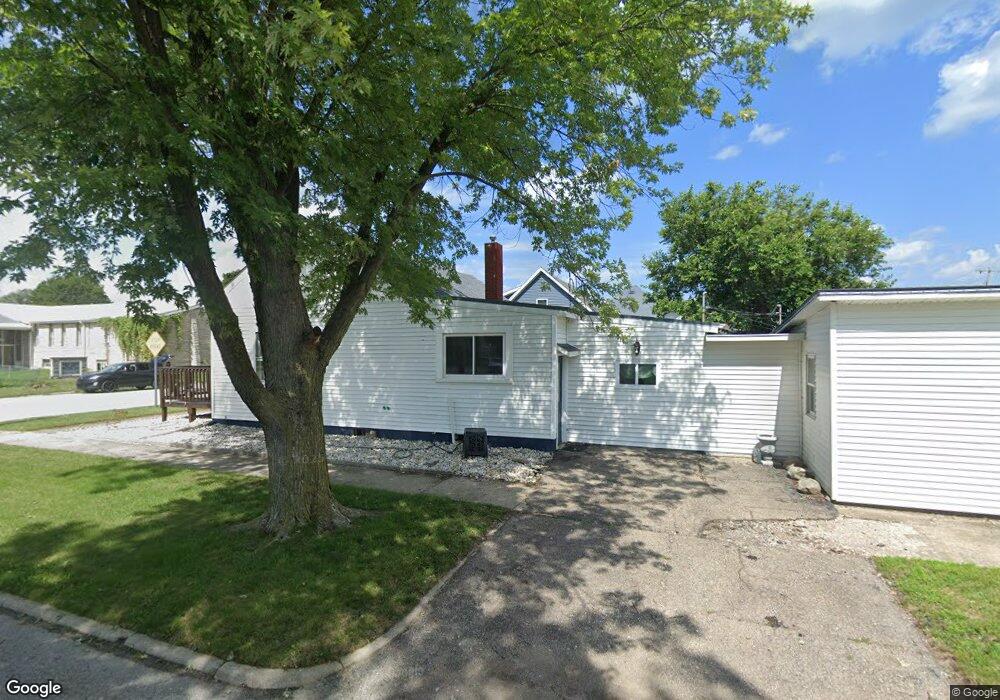
This home is located at 251 E 3rd St, Peru, IN 46970 and is currently estimated at $123,264, approximately $60 per square foot. 251 E 3rd St is a home located in Miami County with nearby schools including Elmwood Primary Learning Center, Blair Pointe Upper Elementary School, and Peru Junior/High School.
Ownership History
Date
Name
Owned For
Owner Type
Purchase Details
Closed on
Jan 7, 2022
Sold by
Edward Dabney
Bought by
Parker Danielle N
Current Estimated Value
Home Financials for this Owner
Home Financials are based on the most recent Mortgage that was taken out on this home.
Original Mortgage
$32,000
Outstanding Balance
$24,568
Interest Rate
2.79%
Mortgage Type
New Conventional
Estimated Equity
$98,696
Purchase Details
Closed on
Jul 13, 2007
Sold by
Brown Joseph Carl
Bought by
Dabney Edward and Daibney Theresa Diann
Purchase Details
Closed on
Aug 31, 2006
Sold by
Grp Loan Llc
Bought by
Zelinsky Victor
Purchase Details
Closed on
Aug 18, 2006
Sold by
New Century Mortgage Corporation
Bought by
Grp Loan Llc
Purchase Details
Closed on
Feb 1, 2006
Sold by
Fv 1 Inc
Bought by
New Century Mortgage Corp
Purchase Details
Closed on
Dec 13, 2005
Sold by
Campbell Jon A and Tucker Patricia C
Bought by
Fv 1 Inc
Create a Home Valuation Report for This Property
The Home Valuation Report is an in-depth analysis detailing your home's value as well as a comparison with similar homes in the area
Home Values in the Area
Average Home Value in this Area
Purchase History
| Date | Buyer | Sale Price | Title Company |
|---|---|---|---|
| Parker Danielle N | -- | Keith Thomas A | |
| Dabney Edward | -- | None Available | |
| Zelinsky Victor | -- | None Available | |
| Grp Loan Llc | -- | None Available | |
| New Century Mortgage Corp | -- | None Available | |
| Fv 1 Inc | -- | None Available |
Source: Public Records
Mortgage History
| Date | Status | Borrower | Loan Amount |
|---|---|---|---|
| Open | Parker Danielle N | $32,000 |
Source: Public Records
Tax History
| Year | Tax Paid | Tax Assessment Tax Assessment Total Assessment is a certain percentage of the fair market value that is determined by local assessors to be the total taxable value of land and additions on the property. | Land | Improvement |
|---|---|---|---|---|
| 2025 | $1,708 | $116,000 | $6,300 | $109,700 |
| 2024 | $1,708 | $85,400 | $6,300 | $79,100 |
| 2023 | $1,708 | $86,500 | $6,300 | $80,200 |
| 2022 | $1,705 | $84,900 | $6,300 | $78,600 |
| 2021 | $1,560 | $77,700 | $6,300 | $71,400 |
| 2020 | $676 | $77,700 | $6,300 | $71,400 |
| 2019 | $666 | $62,800 | $6,300 | $56,500 |
| 2018 | $515 | $52,400 | $6,300 | $46,100 |
| 2017 | $490 | $52,000 | $6,400 | $45,600 |
| 2016 | $458 | $50,200 | $6,400 | $43,800 |
| 2014 | $379 | $49,400 | $6,400 | $43,000 |
| 2013 | -- | $49,000 | $6,400 | $42,600 |
Source: Public Records
Map
Nearby Homes
Your Personal Tour Guide
Ask me questions while you tour the home.