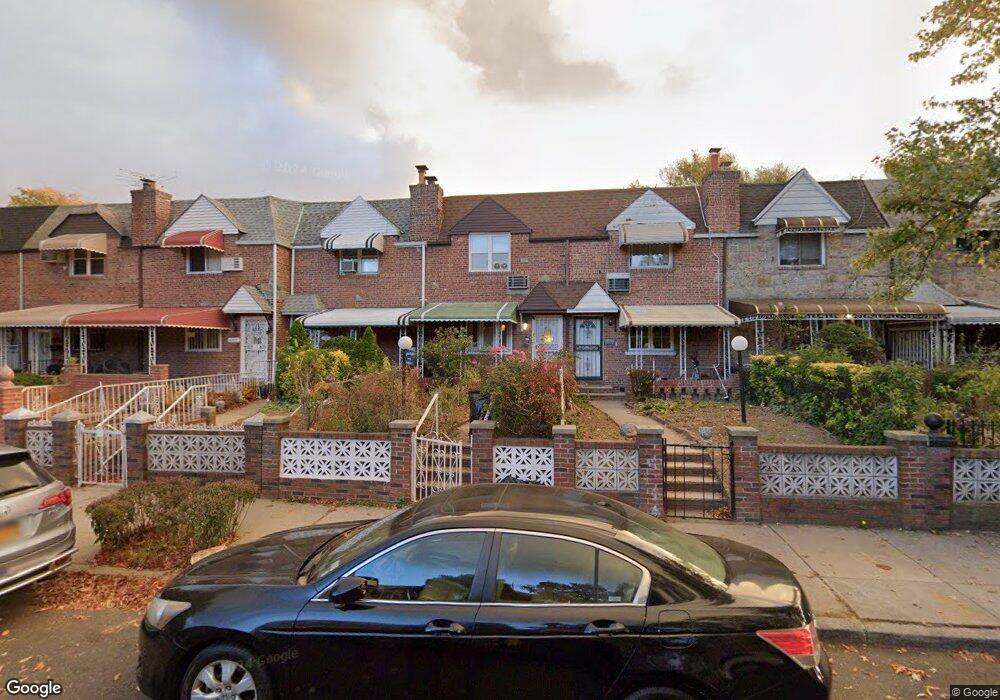
251 E 86th St Brooklyn, NY 11236
East Flatbush NeighborhoodEstimated Value: $566,092 - $753,000
2
Beds
2
Baths
896
Sq Ft
$726/Sq Ft
Est. Value
About This Home
This home is located at 251 E 86th St, Brooklyn, NY 11236 and is currently estimated at $650,273, approximately $725 per square foot. 251 E 86th St is a home located in Kings County with nearby schools including P.S. 233 The Langston Hughes School, I.S. 285 Meyer Levin, and Ivy Hill Preparatory Charter School.
Ownership History
Date
Name
Owned For
Owner Type
Purchase Details
Closed on
Nov 20, 2023
Sold by
Estate Of Terris Williams and Hamilton Joan
Bought by
Hamilton Joan
Current Estimated Value
Purchase Details
Closed on
Oct 29, 2010
Sold by
Nicholson Basil N and Williams Terris
Bought by
Williams Terris
Home Financials for this Owner
Home Financials are based on the most recent Mortgage that was taken out on this home.
Original Mortgage
$19,701
Outstanding Balance
$12,916
Interest Rate
4.3%
Mortgage Type
Purchase Money Mortgage
Estimated Equity
$637,357
Purchase Details
Closed on
Oct 11, 2003
Sold by
Williams Terris
Bought by
Nicholson Basil N and Williams Terris
Purchase Details
Closed on
Apr 27, 1995
Sold by
Trilli Joseph Fred
Bought by
Williams Terris
Home Financials for this Owner
Home Financials are based on the most recent Mortgage that was taken out on this home.
Original Mortgage
$104,000
Interest Rate
8.31%
Mortgage Type
Purchase Money Mortgage
Create a Home Valuation Report for This Property
The Home Valuation Report is an in-depth analysis detailing your home's value as well as a comparison with similar homes in the area
Home Values in the Area
Average Home Value in this Area
Purchase History
| Date | Buyer | Sale Price | Title Company |
|---|---|---|---|
| Hamilton Joan | -- | -- | |
| Hamilton Joan | -- | -- | |
| Hamilton Joan | -- | -- | |
| Williams Terris | -- | -- | |
| Williams Terris | -- | -- | |
| Nicholson Basil N | -- | -- | |
| Nicholson Basil N | -- | -- | |
| Williams Terris | $130,000 | -- | |
| Williams Terris | $130,000 | -- |
Source: Public Records
Mortgage History
| Date | Status | Borrower | Loan Amount |
|---|---|---|---|
| Open | Williams Terris | $19,701 | |
| Closed | Williams Terris | $19,701 | |
| Previous Owner | Williams Terris | $104,000 |
Source: Public Records
Tax History
| Year | Tax Paid | Tax Assessment Tax Assessment Total Assessment is a certain percentage of the fair market value that is determined by local assessors to be the total taxable value of land and additions on the property. | Land | Improvement |
|---|---|---|---|---|
| 2025 | $5,059 | $36,300 | $11,040 | $25,260 |
| 2024 | $5,059 | $34,200 | $11,040 | $23,160 |
| 2023 | $4,825 | $35,880 | $11,040 | $24,840 |
| 2022 | $4,743 | $32,580 | $11,040 | $21,540 |
| 2021 | $4,963 | $28,980 | $11,040 | $17,940 |
| 2020 | $2,327 | $24,240 | $11,040 | $13,200 |
| 2019 | $4,390 | $23,460 | $11,040 | $12,420 |
| 2018 | $4,036 | $19,800 | $10,747 | $9,053 |
| 2017 | $4,036 | $19,800 | $10,811 | $8,989 |
| 2016 | $3,928 | $19,651 | $10,480 | $9,171 |
| 2015 | $2,234 | $18,539 | $11,189 | $7,350 |
| 2014 | $2,234 | $17,490 | $11,584 | $5,906 |
Source: Public Records
Map
Nearby Homes
Your Personal Tour Guide
Ask me questions while you tour the home.