Estimated Value: $232,000 - $268,718
3
Beds
2
Baths
1,599
Sq Ft
$157/Sq Ft
Est. Value
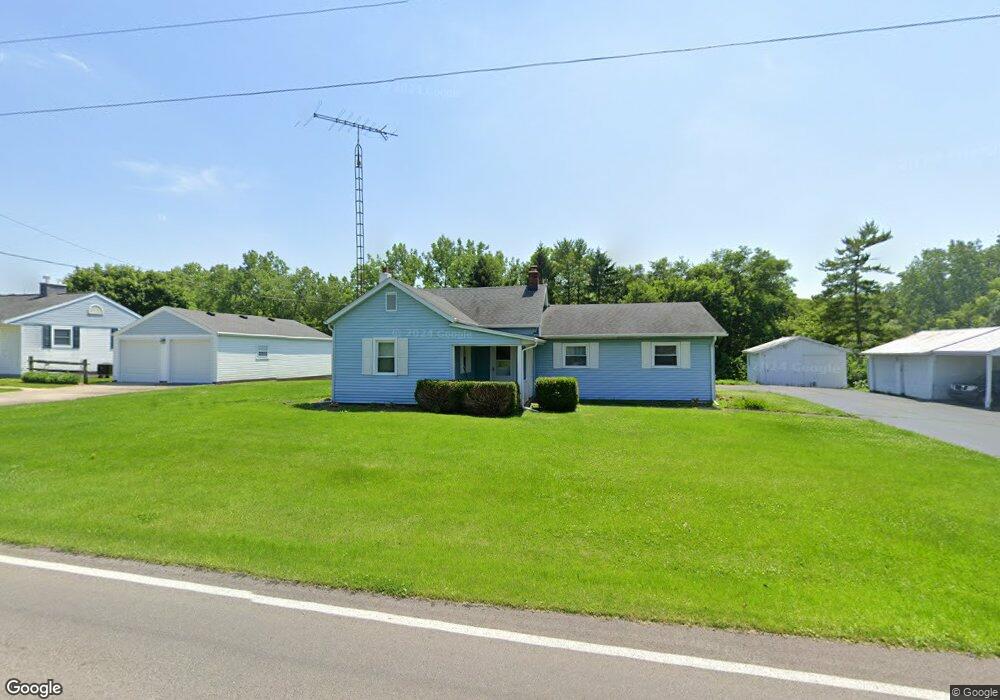
About This Home
This home is located at 251 Fairground Rd, Xenia, OH 45385 and is currently estimated at $251,680, approximately $157 per square foot. 251 Fairground Rd is a home located in Greene County with nearby schools including Xenia High School and Legacy Christian Academy.
Ownership History
Date
Name
Owned For
Owner Type
Purchase Details
Closed on
Aug 28, 2020
Sold by
Carman-Long Wanda S and Long Wanda Carman
Bought by
Brooks Zachary E
Current Estimated Value
Home Financials for this Owner
Home Financials are based on the most recent Mortgage that was taken out on this home.
Original Mortgage
$155,103
Outstanding Balance
$137,644
Interest Rate
2.9%
Mortgage Type
New Conventional
Estimated Equity
$114,036
Purchase Details
Closed on
Jan 4, 2007
Sold by
Long Dennis S
Bought by
Long Dennis S and Long Wanda S
Purchase Details
Closed on
Feb 24, 2000
Sold by
Long Wanda S
Bought by
Long Dennis S
Purchase Details
Closed on
Mar 30, 1998
Sold by
Bahl James M and Bahl Amy Sue
Bought by
Long Dennis S and Long Wanda S
Home Financials for this Owner
Home Financials are based on the most recent Mortgage that was taken out on this home.
Original Mortgage
$92,000
Interest Rate
7.09%
Create a Home Valuation Report for This Property
The Home Valuation Report is an in-depth analysis detailing your home's value as well as a comparison with similar homes in the area
Home Values in the Area
Average Home Value in this Area
Purchase History
| Date | Buyer | Sale Price | Title Company |
|---|---|---|---|
| Brooks Zachary E | -- | None Listed On Document | |
| Long Dennis S | -- | Attorney | |
| Long Dennis S | $20,000 | -- | |
| Long Dennis S | $103,900 | -- |
Source: Public Records
Mortgage History
| Date | Status | Borrower | Loan Amount |
|---|---|---|---|
| Open | Brooks Zachary E | $155,103 | |
| Previous Owner | Long Dennis S | $92,000 |
Source: Public Records
Tax History Compared to Growth
Tax History
| Year | Tax Paid | Tax Assessment Tax Assessment Total Assessment is a certain percentage of the fair market value that is determined by local assessors to be the total taxable value of land and additions on the property. | Land | Improvement |
|---|---|---|---|---|
| 2024 | $3,174 | $65,310 | $16,960 | $48,350 |
| 2023 | $3,174 | $65,310 | $16,960 | $48,350 |
| 2022 | $2,813 | $52,460 | $14,750 | $37,710 |
| 2021 | $2,849 | $52,460 | $14,750 | $37,710 |
| 2020 | $2,222 | $52,460 | $14,750 | $37,710 |
| 2019 | $1,633 | $38,910 | $13,240 | $25,670 |
| 2018 | $1,639 | $38,910 | $13,240 | $25,670 |
| 2017 | $1,581 | $38,910 | $13,240 | $25,670 |
| 2016 | $1,581 | $37,360 | $12,720 | $24,640 |
| 2015 | $793 | $37,360 | $12,720 | $24,640 |
| 2014 | $1,521 | $37,360 | $12,720 | $24,640 |
Source: Public Records
Map
Nearby Homes
- 517 Hollywood Blvd
- 1796 Palmer Ct
- 1791 Palmer Ct
- 532 Hollywood Blvd
- 1802 Palmer Ct
- 1808 Palmer Ct
- Harmony Plan at Grandstone Trace
- Newcastle Plan at Grandstone Trace
- Pendleton Plan at Grandstone Trace
- Bellamy Plan at Grandstone Trace
- Chatham Plan at Grandstone Trace
- 1814 Palmer Ct
- 1820 Palmer Ct
- 493 Hollywood Blvd
- 499 Hollywood Blvd
- 1872 Harris Ln
- 912 Omard Dr
- 1968 El Camino Dr
- 1171 N Detroit St
- 883 Omard Dr
- 241 Fairground Rd
- 271 Fairground Rd
- 295 Fairground Rd
- 301 Purcell Dr
- 295 Purcell Dr
- 271 Purcell Dr
- 255 Purcell Dr
- 300 Purcell Dr
- 286 Purcell Dr
- 276 Purcell Dr
- 270 Purcell Dr
- 247 Purcell Ave
- 258 Purcell Dr
- 241 Purcell Dr
- 254 Purcell Dr
- 237 Purcell Ave
- 277 Purcell Dr
- 144 Fairground Rd
- 216 Purcell Dr
- 205 Purcell Dr