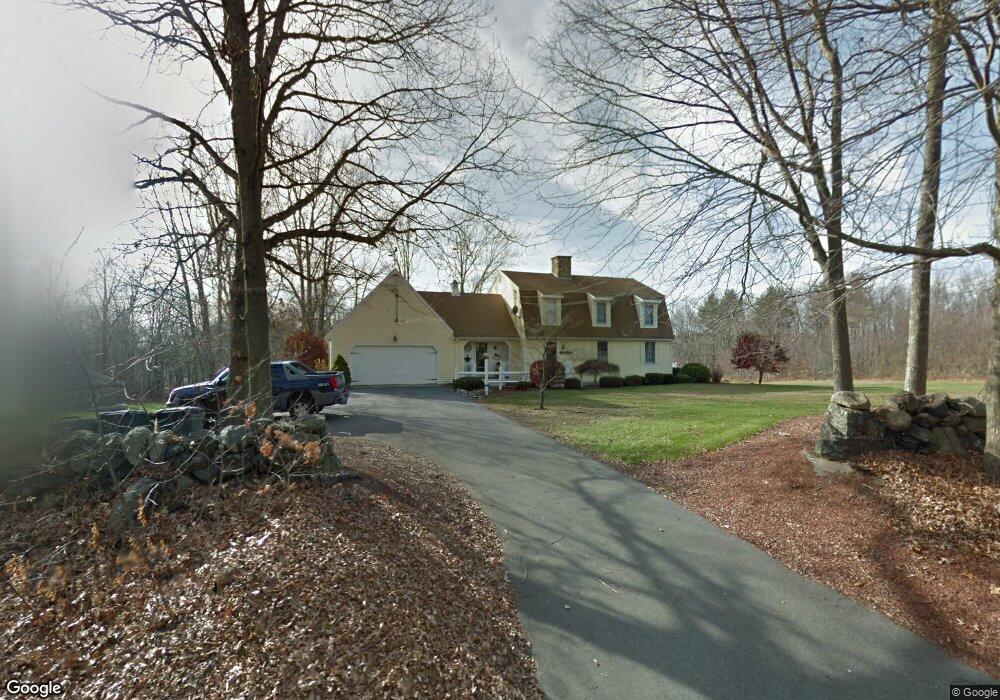
251 Mendon St Blackstone, MA 01504
Estimated Value: $623,000 - $699,000
3
Beds
3
Baths
2,156
Sq Ft
$307/Sq Ft
Est. Value
About This Home
This home is located at 251 Mendon St, Blackstone, MA 01504 and is currently estimated at $661,062, approximately $306 per square foot. 251 Mendon St is a home located in Worcester County with nearby schools including Blackstone-Millville Regional High School.
Ownership History
Date
Name
Owned For
Owner Type
Purchase Details
Closed on
Dec 6, 2004
Sold by
Boucher Jeffrey A and Boucher Patricia M
Bought by
Cordell Thomas C and Cordell Kathy A
Current Estimated Value
Purchase Details
Closed on
Jul 26, 2000
Sold by
Berube Glen R and Berube Jacquie R
Bought by
Boucher Jeffrey A and Boucher Patricia M
Create a Home Valuation Report for This Property
The Home Valuation Report is an in-depth analysis detailing your home's value as well as a comparison with similar homes in the area
Home Values in the Area
Average Home Value in this Area
Purchase History
| Date | Buyer | Sale Price | Title Company |
|---|---|---|---|
| Cordell Thomas C | $405,000 | -- | |
| Boucher Jeffrey A | $260,000 | -- |
Source: Public Records
Mortgage History
| Date | Status | Borrower | Loan Amount |
|---|---|---|---|
| Open | Boucher Jeffrey A | $123,846 | |
| Previous Owner | Boucher Jeffrey A | $150,000 |
Source: Public Records
Tax History Compared to Growth
Tax History
| Year | Tax Paid | Tax Assessment Tax Assessment Total Assessment is a certain percentage of the fair market value that is determined by local assessors to be the total taxable value of land and additions on the property. | Land | Improvement |
|---|---|---|---|---|
| 2025 | $7,547 | $499,800 | $173,900 | $325,900 |
| 2024 | $7,069 | $432,900 | $173,900 | $259,000 |
| 2023 | $6,854 | $423,600 | $173,900 | $249,700 |
| 2022 | $7,106 | $397,000 | $166,200 | $230,800 |
| 2021 | $6,795 | $363,000 | $151,100 | $211,900 |
| 2020 | $6,954 | $368,700 | $151,300 | $217,400 |
| 2019 | $6,775 | $358,300 | $138,800 | $219,500 |
| 2018 | $10,423 | $332,500 | $132,300 | $200,200 |
| 2017 | $6,155 | $319,600 | $132,300 | $187,300 |
| 2016 | $6,162 | $318,600 | $123,200 | $195,400 |
| 2015 | $6,058 | $311,000 | $123,200 | $187,800 |
Source: Public Records
Map
Nearby Homes