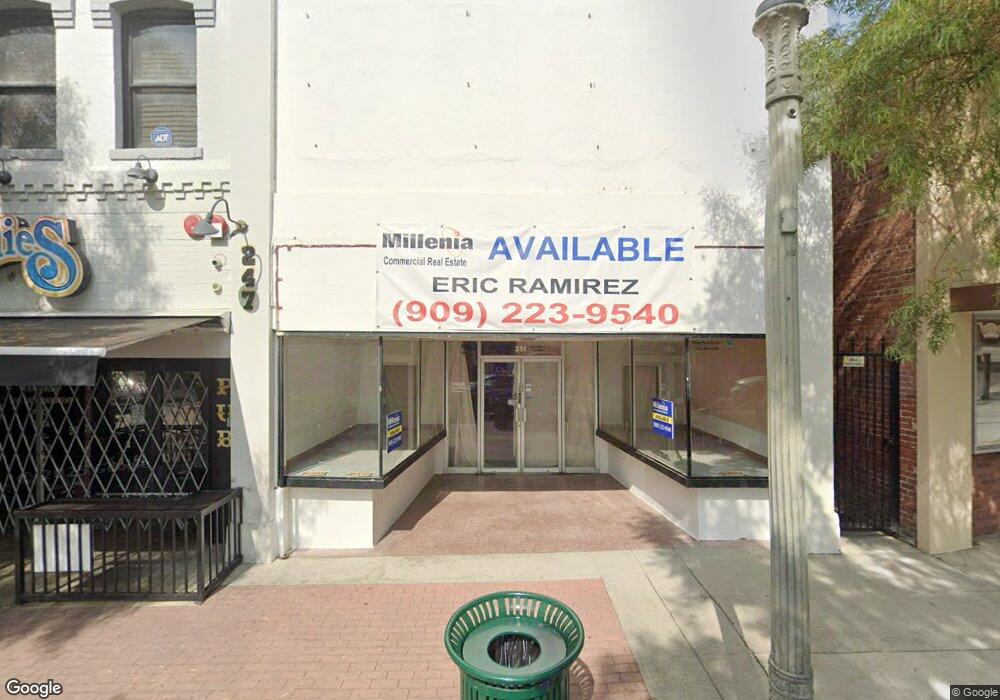
251 N 2nd Ave Upland, CA 91786
Estimated Value: $852,754
--
Bed
--
Bath
940
Sq Ft
$907/Sq Ft
Est. Value
About This Home
This home is located at 251 N 2nd Ave, Upland, CA 91786 and is currently estimated at $852,754, approximately $907 per square foot. 251 N 2nd Ave is a home located in San Bernardino County with nearby schools including Upland Elementary School, Upland Junior High School, and Upland High School.
Ownership History
Date
Name
Owned For
Owner Type
Purchase Details
Closed on
Jun 20, 2017
Sold by
Tapp James Edward
Bought by
Tapp Teresa Kay
Current Estimated Value
Purchase Details
Closed on
Jun 13, 2017
Sold by
Parker David and Henson Parker Dorothy
Bought by
Cayley Laura and Cayley Irene
Purchase Details
Closed on
Sep 24, 2015
Sold by
Manos Patricia Ellen and The Burns Living Trust
Bought by
Kay Manos Patricia Ellen and Kay Tappm Teresa
Purchase Details
Closed on
Aug 5, 2014
Sold by
Burns Archie D and Manos Patricia Ellen
Bought by
Burns Archie David and The Burns Living Trust
Purchase Details
Closed on
Mar 23, 1999
Sold by
Harris Bonnie K
Bought by
Harris Gary L and Harris Bonnie K
Purchase Details
Closed on
Jul 24, 1998
Sold by
Henson Parker Dorothy
Bought by
Parker David and Henson Parker Dorothy
Purchase Details
Closed on
May 8, 1997
Sold by
Brinton Family Trust The and Bonnie K
Bought by
Harris Bonnie K and Henson Parker Dorothy
Create a Home Valuation Report for This Property
The Home Valuation Report is an in-depth analysis detailing your home's value as well as a comparison with similar homes in the area
Home Values in the Area
Average Home Value in this Area
Purchase History
| Date | Buyer | Sale Price | Title Company |
|---|---|---|---|
| Tapp Teresa Kay | -- | Ticor Title Company | |
| Cayley Laura | $508,500 | Ticor Title Company Of Ca | |
| Kay Manos Patricia Ellen | -- | None Available | |
| Burns Archie David | -- | Chicago Title Co | |
| Harris Gary L | -- | -- | |
| Parker David | -- | -- | |
| Harris Bonnie K | -- | -- |
Source: Public Records
Tax History Compared to Growth
Tax History
| Year | Tax Paid | Tax Assessment Tax Assessment Total Assessment is a certain percentage of the fair market value that is determined by local assessors to be the total taxable value of land and additions on the property. | Land | Improvement |
|---|---|---|---|---|
| 2025 | $6,324 | $590,157 | $208,905 | $381,252 |
| 2024 | $6,324 | $578,585 | $204,809 | $373,776 |
| 2023 | $6,230 | $567,240 | $200,793 | $366,447 |
| 2022 | $6,096 | $556,118 | $196,856 | $359,262 |
| 2021 | $6,090 | $545,214 | $192,996 | $352,218 |
| 2020 | $5,925 | $539,623 | $191,017 | $348,606 |
| 2019 | $5,905 | $529,043 | $187,272 | $341,771 |
| 2018 | $5,761 | $518,670 | $183,600 | $335,070 |
| 2017 | $2,367 | $206,105 | $60,264 | $145,841 |
| 2016 | $1,690 | $155,464 | $41,273 | $114,191 |
| 2015 | $1,652 | $153,129 | $40,653 | $112,476 |
| 2014 | $1,610 | $150,130 | $39,857 | $110,273 |
Source: Public Records
Map
Nearby Homes
- Plan 3 at Towns on First - Towns On First
- Plan 4 at Towns on First - Towns On First
- 389 N 3rd Ave
- 119 N 1st Ave
- 384 Ruby Red Ln
- 144 Dorsett Ave
- 152 Dorsett Ave
- 511 D St
- 147 Royal Way
- 144 Royal Way
- 181 Dorsett Ave
- 556 D St
- 524 E Arrow Hwy
- 164 Euclid Place
- 580 Katy Dr
- 691 N 3rd Ave
- 173 W 8th St
- 173 Elizabeth Ln
- 435 W 9th St Unit A6
- 435 W 9th St Unit F5