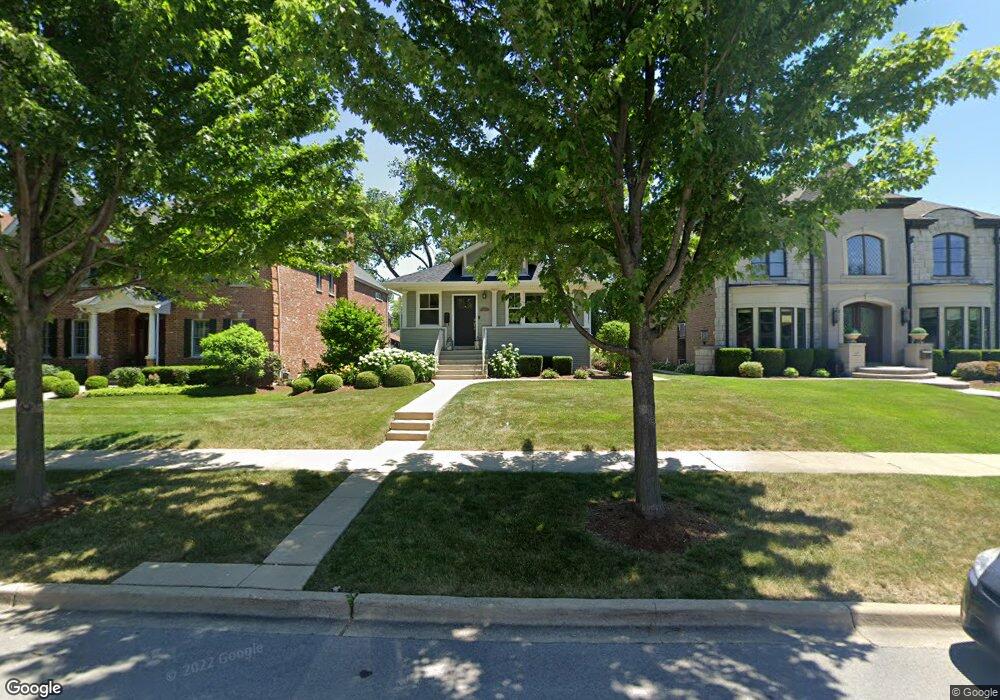
251 N Indiana St Elmhurst, IL 60126
Estimated Value: $516,592 - $699,000
--
Bed
--
Bath
1,313
Sq Ft
$456/Sq Ft
Est. Value
About This Home
This home is located at 251 N Indiana St, Elmhurst, IL 60126 and is currently estimated at $598,648, approximately $455 per square foot. 251 N Indiana St is a home located in DuPage County with nearby schools including Ruggles Elementary School, Field Elementary School, and Sandburg Middle School.
Ownership History
Date
Name
Owned For
Owner Type
Purchase Details
Closed on
Mar 25, 1999
Sold by
Harris Bank Hinsdale
Bought by
Welz Daniel P and Welz Allison M
Current Estimated Value
Home Financials for this Owner
Home Financials are based on the most recent Mortgage that was taken out on this home.
Original Mortgage
$202,500
Outstanding Balance
$41,805
Interest Rate
5%
Estimated Equity
$556,843
Purchase Details
Closed on
Aug 20, 1993
Sold by
David Suzanne
Bought by
David Christopher M
Create a Home Valuation Report for This Property
The Home Valuation Report is an in-depth analysis detailing your home's value as well as a comparison with similar homes in the area
Home Values in the Area
Average Home Value in this Area
Purchase History
| Date | Buyer | Sale Price | Title Company |
|---|---|---|---|
| Welz Daniel P | $225,000 | -- | |
| David Christopher M | -- | -- |
Source: Public Records
Mortgage History
| Date | Status | Borrower | Loan Amount |
|---|---|---|---|
| Open | Welz Daniel P | $202,500 |
Source: Public Records
Tax History Compared to Growth
Tax History
| Year | Tax Paid | Tax Assessment Tax Assessment Total Assessment is a certain percentage of the fair market value that is determined by local assessors to be the total taxable value of land and additions on the property. | Land | Improvement |
|---|---|---|---|---|
| 2024 | $7,827 | $137,867 | $84,230 | $53,637 |
| 2023 | $7,254 | $127,490 | $77,890 | $49,600 |
| 2022 | $7,046 | $122,190 | $74,890 | $47,300 |
| 2021 | $6,868 | $119,150 | $73,030 | $46,120 |
| 2020 | $6,600 | $116,540 | $71,430 | $45,110 |
| 2019 | $6,455 | $110,800 | $67,910 | $42,890 |
| 2018 | $5,963 | $102,260 | $64,280 | $37,980 |
| 2017 | $5,826 | $97,440 | $61,250 | $36,190 |
| 2016 | $5,695 | $91,790 | $57,700 | $34,090 |
| 2015 | $5,627 | $85,510 | $53,750 | $31,760 |
| 2014 | $6,254 | $87,160 | $42,670 | $44,490 |
| 2013 | $6,189 | $88,390 | $43,270 | $45,120 |
Source: Public Records
Map
Nearby Homes
- 240 N Willow Rd
- 286 N Indiana St
- 234 E Grantley Ave
- 183 E Grantley Ave
- 260 E Grantley Ave
- 195 N Addison Ave Unit PH03
- 254 N Addison Ave
- 260 N Addison Ave
- 258 N Addison Ave
- 262 N Addison Ave
- 110 N Pine St
- 145 S York St Unit 404
- 145 S York St Unit 322
- 105 S Cottage Hill Ave Unit 304
- 153 S Kenmore Ave
- 131 W Adelaide St Unit 309
- 193 N Elm Ave
- 128 S Linden Ave
- 134 N Caroline Ave
- 314 N Elm Ave
- 255 N Indiana St
- 247 N Indiana St
- 259 N Indiana St
- 243 N Indiana St
- 263 N Indiana St
- 256 N Willow Rd
- 252 N Willow Rd
- 260 N Willow Rd
- 219 E 3rd St
- 267 N Indiana St
- 246 N Indiana St
- 250 N Indiana St
- 256 N Indiana St
- 242 N Indiana St
- 268 N Willow Rd
- 233 N Indiana St
- 258 N Indiana St
- 271 N Indiana St
- 262 N Indiana St
- 272 N Willow Rd