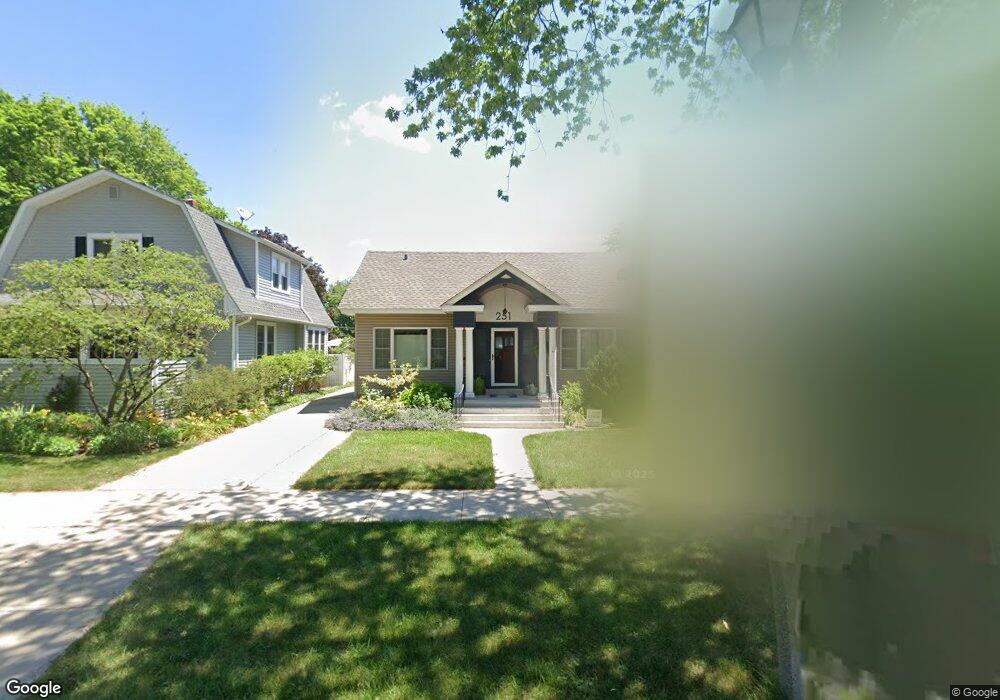
251 N Michigan Ave Elmhurst, IL 60126
Estimated Value: $584,000 - $782,000
--
Bed
--
Bath
1,621
Sq Ft
$398/Sq Ft
Est. Value
About This Home
This home is located at 251 N Michigan Ave, Elmhurst, IL 60126 and is currently estimated at $645,765, approximately $398 per square foot. 251 N Michigan Ave is a home located in DuPage County with nearby schools including Ruggles Elementary School, Field Elementary School, and Sandburg Middle School.
Ownership History
Date
Name
Owned For
Owner Type
Purchase Details
Closed on
Oct 9, 2015
Sold by
Goetz Thomas J and Spathis Joanna M
Bought by
Slavik Theodore M and Slavik Victoria L
Current Estimated Value
Purchase Details
Closed on
Sep 8, 2011
Sold by
Goetz Thomas J
Bought by
Goetz Thomas J and Spathis Joanna M
Home Financials for this Owner
Home Financials are based on the most recent Mortgage that was taken out on this home.
Original Mortgage
$215,000
Interest Rate
4.4%
Mortgage Type
New Conventional
Purchase Details
Closed on
Apr 30, 1998
Sold by
Kahman Jane M and Kahman Robert T
Bought by
Goetz Thomas J
Home Financials for this Owner
Home Financials are based on the most recent Mortgage that was taken out on this home.
Original Mortgage
$129,000
Interest Rate
7.19%
Create a Home Valuation Report for This Property
The Home Valuation Report is an in-depth analysis detailing your home's value as well as a comparison with similar homes in the area
Home Values in the Area
Average Home Value in this Area
Purchase History
| Date | Buyer | Sale Price | Title Company |
|---|---|---|---|
| Slavik Theodore M | $400,000 | First American Title Company | |
| Goetz Thomas J | -- | Fidelity | |
| Goetz Thomas J | $145,000 | -- |
Source: Public Records
Mortgage History
| Date | Status | Borrower | Loan Amount |
|---|---|---|---|
| Previous Owner | Goetz Thomas J | $215,000 | |
| Previous Owner | Goetz Thomas J | $129,000 |
Source: Public Records
Tax History Compared to Growth
Tax History
| Year | Tax Paid | Tax Assessment Tax Assessment Total Assessment is a certain percentage of the fair market value that is determined by local assessors to be the total taxable value of land and additions on the property. | Land | Improvement |
|---|---|---|---|---|
| 2024 | $10,248 | $178,052 | $101,727 | $76,325 |
| 2023 | $9,510 | $164,650 | $94,070 | $70,580 |
| 2022 | $9,234 | $158,280 | $90,440 | $67,840 |
| 2021 | $9,004 | $154,340 | $88,190 | $66,150 |
| 2020 | $8,655 | $150,960 | $86,260 | $64,700 |
| 2019 | $8,471 | $143,520 | $82,010 | $61,510 |
| 2018 | $7,856 | $132,810 | $77,650 | $55,160 |
| 2017 | $7,681 | $126,550 | $73,990 | $52,560 |
| 2016 | $7,515 | $119,210 | $69,700 | $49,510 |
| 2015 | $7,435 | $111,050 | $64,930 | $46,120 |
| 2014 | $7,166 | $98,990 | $51,520 | $47,470 |
| 2013 | $7,090 | $100,390 | $52,250 | $48,140 |
Source: Public Records
Map
Nearby Homes
- 286 N Indiana St
- 240 N Willow Rd
- 195 N Addison Ave Unit PH03
- 260 N Addison Ave
- 254 N Addison Ave
- 258 N Addison Ave
- 262 N Addison Ave
- 183 E Grantley Ave
- 234 E Grantley Ave
- 260 E Grantley Ave
- 193 N Elm Ave
- 105 S Cottage Hill Ave Unit 304
- 314 N Elm Ave
- 131 W Adelaide St Unit 309
- 110 N Pine St
- 145 S York St Unit 404
- 145 S York St Unit 322
- 153 S Kenmore Ave
- 104 Evergreen Ave
- 456 N Elm Ave
- 247 N Michigan Ave
- 255 N Michigan Ave
- 257 N Michigan Ave
- 241 N Michigan Ave
- 265 N Michigan Ave
- 239 N Michigan Ave
- 256 N Illinois St
- 235 N Michigan Ave
- 267 N Michigan Ave
- 248 N Illinois St
- 260 N Illinois St
- 252 N Illinois St
- 250 N Michigan Ave
- 254 N Michigan Ave
- 246 N Michigan Ave
- 264 N Illinois St
- 258 N Michigan Ave
- 268 N Illinois St
- 229 N Michigan Ave
- 244 N Michigan Ave