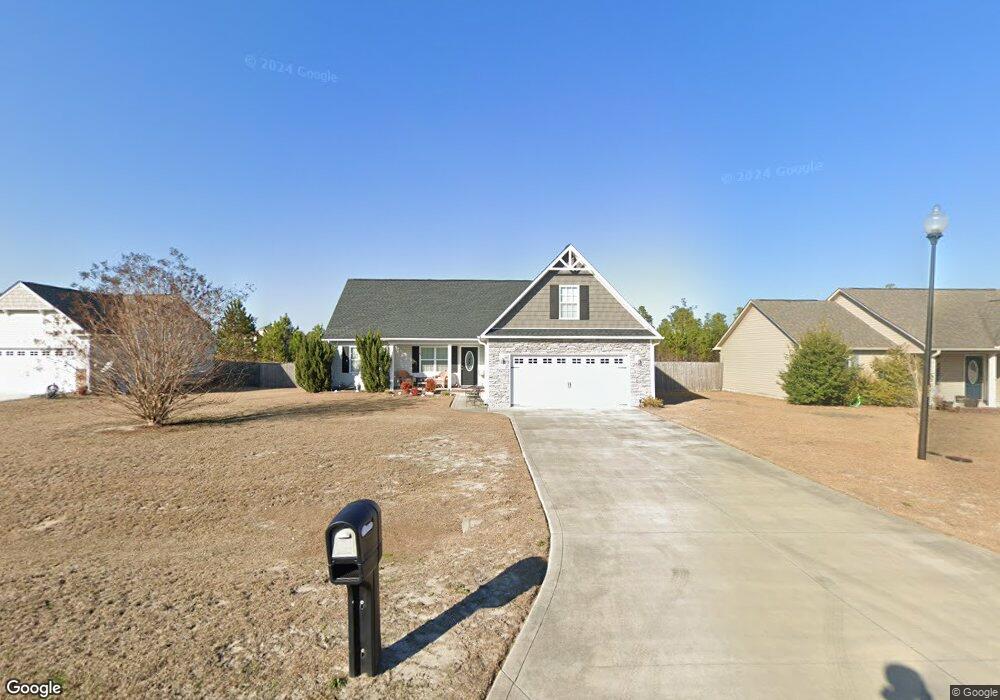
251 Rowland Dr Richlands, NC 28574
Estimated Value: $295,472 - $307,000
3
Beds
2
Baths
1,803
Sq Ft
$168/Sq Ft
Est. Value
About This Home
This home is located at 251 Rowland Dr, Richlands, NC 28574 and is currently estimated at $302,618, approximately $167 per square foot. 251 Rowland Dr is a home located in Onslow County with nearby schools including Richlands Elementary School, Trexler Middle School, and Richlands High School.
Ownership History
Date
Name
Owned For
Owner Type
Purchase Details
Closed on
Mar 15, 2022
Sold by
Long Stephen J
Bought by
Long Stephen J and Garcia Saralinda Guzman
Current Estimated Value
Purchase Details
Closed on
Jun 25, 2014
Sold by
Atlantic Construction Inc
Bought by
Long Stephen J and Long Andrea R
Home Financials for this Owner
Home Financials are based on the most recent Mortgage that was taken out on this home.
Original Mortgage
$183,767
Interest Rate
4.23%
Mortgage Type
VA
Purchase Details
Closed on
Oct 31, 2013
Sold by
Cehrrywood Developers Inc
Bought by
Atlantic Constructoon Inc
Home Financials for this Owner
Home Financials are based on the most recent Mortgage that was taken out on this home.
Original Mortgage
$117,000
Interest Rate
4.23%
Mortgage Type
Future Advance Clause Open End Mortgage
Create a Home Valuation Report for This Property
The Home Valuation Report is an in-depth analysis detailing your home's value as well as a comparison with similar homes in the area
Home Values in the Area
Average Home Value in this Area
Purchase History
| Date | Buyer | Sale Price | Title Company |
|---|---|---|---|
| Long Stephen J | -- | Mewborn & Deselms | |
| Long Stephen J | $180,000 | None Available | |
| Atlantic Constructoon Inc | $64,000 | None Available |
Source: Public Records
Mortgage History
| Date | Status | Borrower | Loan Amount |
|---|---|---|---|
| Previous Owner | Long Stephen J | $183,767 | |
| Previous Owner | Atlantic Constructoon Inc | $117,000 |
Source: Public Records
Tax History Compared to Growth
Tax History
| Year | Tax Paid | Tax Assessment Tax Assessment Total Assessment is a certain percentage of the fair market value that is determined by local assessors to be the total taxable value of land and additions on the property. | Land | Improvement |
|---|---|---|---|---|
| 2025 | $1,157 | $221,691 | $32,000 | $189,691 |
| 2024 | $1,157 | $221,691 | $32,000 | $189,691 |
| 2023 | $1,157 | $221,691 | $32,000 | $189,691 |
| 2022 | $1,157 | $221,691 | $32,000 | $189,691 |
| 2021 | $943 | $178,700 | $32,000 | $146,700 |
| 2020 | $1,260 | $178,700 | $32,000 | $146,700 |
| 2019 | $1,260 | $178,700 | $32,000 | $146,700 |
| 2018 | $1,260 | $178,700 | $32,000 | $146,700 |
| 2017 | $1,198 | $177,480 | $30,000 | $147,480 |
| 2016 | $1,198 | $177,480 | $0 | $0 |
| 2015 | $1,198 | $177,480 | $0 | $0 |
| 2014 | $1,198 | $30,000 | $0 | $0 |
Source: Public Records
Map
Nearby Homes
- 260 Rowland Dr
- 250 Rowland Dr
- 503 Hester Ct
- 224 Rowland Dr
- 1955 Catherine Lake Rd
- 712 Addor Dr
- 106 Orchard Dr
- 227 Bannermans Mill Rd
- 233 Pineview Rd
- 105 Linden Rd
- 248 Fire Tower Rd
- 115 Flat Rock Ln
- 235 Westfield Dr
- 109 Floyd Pond Ln
- 145 Mcgowan
- 252 Newbold Rd
- 119 Edgewater Ln
- 1.7ac Mcgowan Rd
- 000 Richlands
- 101 Daleview Ct
- 249 Rowland Dr
- 249 Rowland Dr Unit Lot 64
- 253 Rowland Dr
- 247 Rowland Dr
- 255 Rowland Dr
- 255 Rowland Dr Unit Lot 67
- 258 Rowland Dr
- 257 Rowland Dr
- 254 Rowland Dr
- 504 Hester Ct
- 506 Hester Ct
- 252 Rowland Dr
- 262 Rowland Dr
- 243 Rowland Dr
- 259 Rowland Dr
- 507 Hester Ct
- 250 Rowland Dale
- 502 Hester Ct
- 264 Rowland Dr Unit Lot # 73
- 264 Rowland Dr