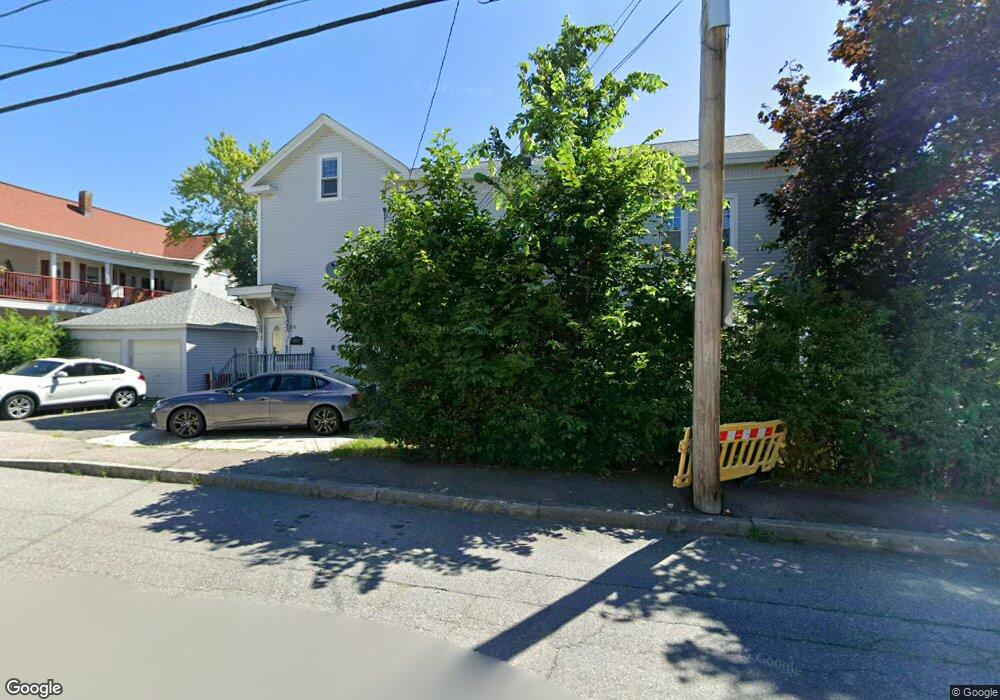
251 Shaw St Lowell, MA 01851
Lower Highlands NeighborhoodEstimated Value: $694,000 - $818,000
6
Beds
2
Baths
3,318
Sq Ft
$224/Sq Ft
Est. Value
About This Home
This home is located at 251 Shaw St, Lowell, MA 01851 and is currently estimated at $744,393, approximately $224 per square foot. 251 Shaw St is a home located in Middlesex County with nearby schools including Charles W. Morey Elementary School, Abraham Lincoln Elementary School, and Dr. Gertrude Bailey Elementary School.
Ownership History
Date
Name
Owned For
Owner Type
Purchase Details
Closed on
Apr 24, 2017
Sold by
Nou Mom C and Wells Fargo Bank Na
Bought by
Union Park Investments
Current Estimated Value
Home Financials for this Owner
Home Financials are based on the most recent Mortgage that was taken out on this home.
Original Mortgage
$212,500
Outstanding Balance
$176,832
Interest Rate
4.21%
Mortgage Type
New Conventional
Estimated Equity
$567,561
Purchase Details
Closed on
Jun 4, 2003
Sold by
Souza Mark
Bought by
Nou Mom C
Home Financials for this Owner
Home Financials are based on the most recent Mortgage that was taken out on this home.
Original Mortgage
$283,500
Interest Rate
5.83%
Mortgage Type
Purchase Money Mortgage
Purchase Details
Closed on
Dec 30, 1997
Sold by
Souza Edward and Souza Helen F
Bought by
Souza Mark
Create a Home Valuation Report for This Property
The Home Valuation Report is an in-depth analysis detailing your home's value as well as a comparison with similar homes in the area
Home Values in the Area
Average Home Value in this Area
Purchase History
| Date | Buyer | Sale Price | Title Company |
|---|---|---|---|
| Union Park Investments | $250,000 | -- | |
| Union Park Investments | $250,000 | -- | |
| Nou Mom C | $315,000 | -- | |
| Nou Mom C | $315,000 | -- | |
| Souza Mark | $50,000 | -- | |
| Souza Mark | $50,000 | -- |
Source: Public Records
Mortgage History
| Date | Status | Borrower | Loan Amount |
|---|---|---|---|
| Open | Union Park Investments | $212,500 | |
| Closed | Souza Mark | $212,500 | |
| Previous Owner | Nou Mom C | $283,500 | |
| Previous Owner | Souza Mark | $32,000 |
Source: Public Records
Tax History Compared to Growth
Tax History
| Year | Tax Paid | Tax Assessment Tax Assessment Total Assessment is a certain percentage of the fair market value that is determined by local assessors to be the total taxable value of land and additions on the property. | Land | Improvement |
|---|---|---|---|---|
| 2025 | $8,307 | $723,600 | $156,200 | $567,400 |
| 2024 | $7,645 | $641,900 | $140,600 | $501,300 |
| 2023 | $7,112 | $572,600 | $122,200 | $450,400 |
| 2022 | $6,577 | $518,300 | $111,100 | $407,200 |
| 2021 | $6,099 | $453,100 | $96,700 | $356,400 |
| 2020 | $5,516 | $412,900 | $84,500 | $328,400 |
| 2019 | $4,914 | $350,000 | $78,200 | $271,800 |
| 2018 | $4,526 | $314,500 | $71,200 | $243,300 |
| 2017 | $4,278 | $286,700 | $64,700 | $222,000 |
| 2016 | $4,199 | $277,000 | $61,600 | $215,400 |
| 2015 | $3,884 | $250,900 | $63,100 | $187,800 |
| 2013 | $3,515 | $234,200 | $75,400 | $158,800 |
Source: Public Records
Map
Nearby Homes