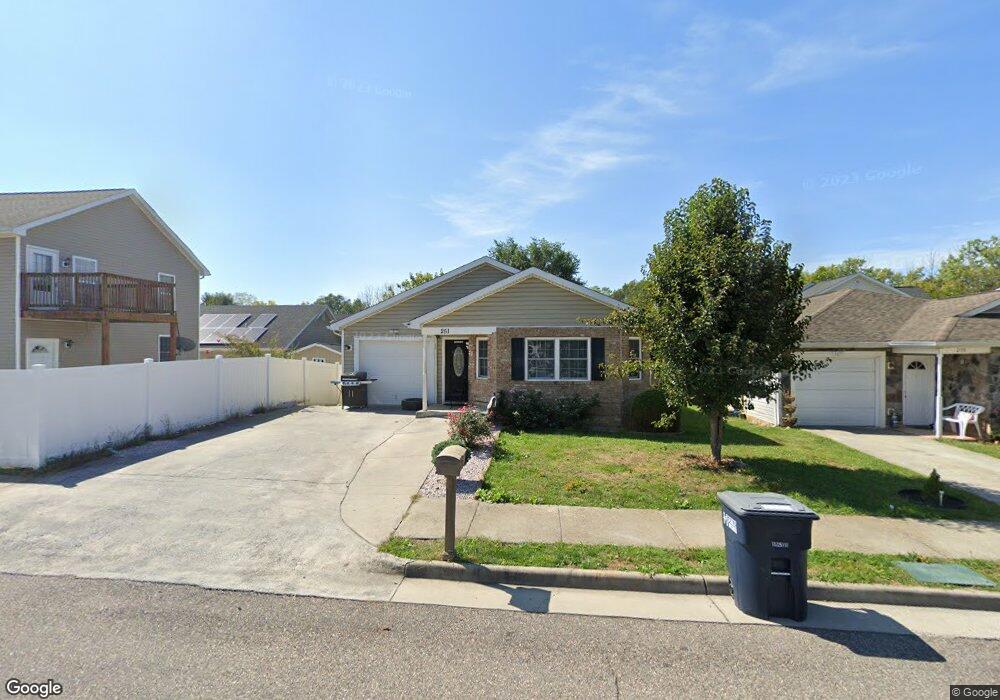
251 Suter St Harrisonburg, VA 22802
Estimated Value: $305,000 - $325,000
3
Beds
2
Baths
1,439
Sq Ft
$221/Sq Ft
Est. Value
About This Home
This home is located at 251 Suter St, Harrisonburg, VA 22802 and is currently estimated at $318,271, approximately $221 per square foot. 251 Suter St is a home located in Harrisonburg City with nearby schools including Waterman Elementary School, Thomas Harrison Middle School, and Harrisonburg High School.
Ownership History
Date
Name
Owned For
Owner Type
Purchase Details
Closed on
Jul 26, 2016
Sold by
Funes Jose T and Funes Nardy R
Bought by
Jandres Raul A and Martinez Alba L
Current Estimated Value
Purchase Details
Closed on
Jun 26, 2008
Sold by
Diversified Development Solutions Llc
Bought by
Funes Jose T and Funes Nardy R
Home Financials for this Owner
Home Financials are based on the most recent Mortgage that was taken out on this home.
Original Mortgage
$194,162
Interest Rate
6.49%
Mortgage Type
FHA
Create a Home Valuation Report for This Property
The Home Valuation Report is an in-depth analysis detailing your home's value as well as a comparison with similar homes in the area
Home Values in the Area
Average Home Value in this Area
Purchase History
| Date | Buyer | Sale Price | Title Company |
|---|---|---|---|
| Jandres Raul A | $166,000 | Stewart Title Guaranty Co | |
| Funes Jose T | -- | West View Title Agency Inc |
Source: Public Records
Mortgage History
| Date | Status | Borrower | Loan Amount |
|---|---|---|---|
| Previous Owner | Funes Jose T | $194,162 |
Source: Public Records
Tax History Compared to Growth
Tax History
| Year | Tax Paid | Tax Assessment Tax Assessment Total Assessment is a certain percentage of the fair market value that is determined by local assessors to be the total taxable value of land and additions on the property. | Land | Improvement |
|---|---|---|---|---|
| 2024 | $2,786 | $275,800 | $41,800 | $234,000 |
| 2023 | $2,292 | $238,800 | $33,000 | $205,800 |
| 2022 | $2,022 | $217,400 | $30,000 | $187,400 |
| 2021 | $1,781 | $197,900 | $30,000 | $167,900 |
| 2020 | $1,586 | $180,900 | $30,000 | $150,900 |
| 2019 | $1,586 | $180,900 | $30,000 | $150,900 |
| 2018 | $1,143 | $173,400 | $30,000 | $143,400 |
| 2017 | $1,143 | $157,800 | $30,000 | $127,800 |
| 2016 | $1,143 | $157,800 | $30,000 | $127,800 |
| 2015 | $1,143 | $158,800 | $31,000 | $127,800 |
| 2014 | -- | $163,600 | $33,000 | $130,600 |
Source: Public Records
Map
Nearby Homes