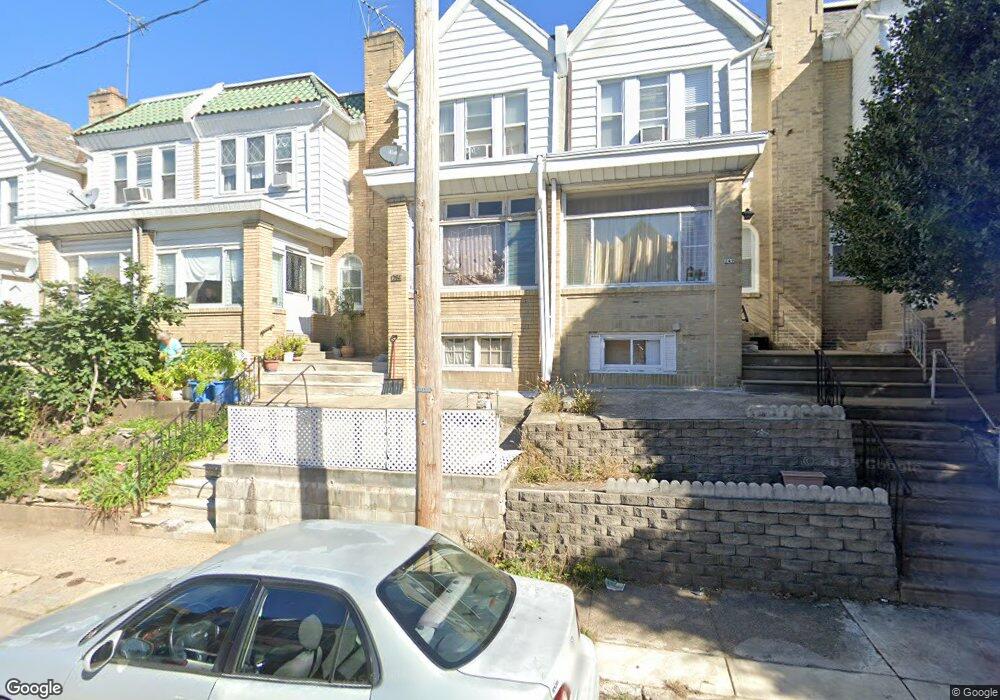
251 Wembly Rd Upper Darby, PA 19082
Estimated Value: $196,000 - $240,000
3
Beds
2
Baths
1,415
Sq Ft
$150/Sq Ft
Est. Value
About This Home
This home is located at 251 Wembly Rd, Upper Darby, PA 19082 and is currently estimated at $211,995, approximately $149 per square foot. 251 Wembly Rd is a home located in Delaware County with nearby schools including Bywood Elementary School, Upper Darby Kdg Center, and Upper Darby High School.
Ownership History
Date
Name
Owned For
Owner Type
Purchase Details
Closed on
May 6, 2008
Sold by
Vanluu Nguyen and Dong Thom Thi
Bought by
Dolley Mohammad F and Komara Marsha
Current Estimated Value
Home Financials for this Owner
Home Financials are based on the most recent Mortgage that was taken out on this home.
Original Mortgage
$84,800
Outstanding Balance
$53,788
Interest Rate
5.91%
Mortgage Type
Purchase Money Mortgage
Estimated Equity
$158,207
Purchase Details
Closed on
Jul 23, 2003
Sold by
Va
Bought by
Vanluu Nguyen Van and Dong Thom Thi
Purchase Details
Closed on
Apr 2, 2003
Sold by
Bright Terrence C and Norwest Mortgage Inc
Bought by
Va
Purchase Details
Closed on
Aug 29, 1997
Sold by
Johnson Paul D and Johnson Jill M
Bought by
Bright Terrence C
Home Financials for this Owner
Home Financials are based on the most recent Mortgage that was taken out on this home.
Original Mortgage
$59,150
Interest Rate
7.47%
Mortgage Type
VA
Create a Home Valuation Report for This Property
The Home Valuation Report is an in-depth analysis detailing your home's value as well as a comparison with similar homes in the area
Home Values in the Area
Average Home Value in this Area
Purchase History
| Date | Buyer | Sale Price | Title Company |
|---|---|---|---|
| Dolley Mohammad F | $106,000 | None Available | |
| Vanluu Nguyen Van | $45,150 | -- | |
| Va | $913 | -- | |
| Bright Terrence C | $58,000 | -- |
Source: Public Records
Mortgage History
| Date | Status | Borrower | Loan Amount |
|---|---|---|---|
| Open | Dolley Mohammad F | $84,800 | |
| Previous Owner | Bright Terrence C | $59,150 |
Source: Public Records
Tax History
| Year | Tax Paid | Tax Assessment Tax Assessment Total Assessment is a certain percentage of the fair market value that is determined by local assessors to be the total taxable value of land and additions on the property. | Land | Improvement |
|---|---|---|---|---|
| 2025 | $3,789 | $89,600 | $22,070 | $67,530 |
| 2024 | $3,789 | $89,600 | $22,070 | $67,530 |
| 2023 | $3,754 | $89,600 | $22,070 | $67,530 |
| 2022 | $3,653 | $89,600 | $22,070 | $67,530 |
| 2021 | $4,925 | $89,600 | $22,070 | $67,530 |
| 2020 | $3,402 | $52,590 | $17,170 | $35,420 |
| 2019 | $3,342 | $52,590 | $17,170 | $35,420 |
| 2018 | $3,304 | $52,590 | $0 | $0 |
| 2017 | $3,218 | $52,590 | $0 | $0 |
| 2016 | $289 | $52,590 | $0 | $0 |
| 2015 | $289 | $52,590 | $0 | $0 |
| 2014 | $289 | $52,590 | $0 | $0 |
Source: Public Records
Map
Nearby Homes
Your Personal Tour Guide
Ask me questions while you tour the home.