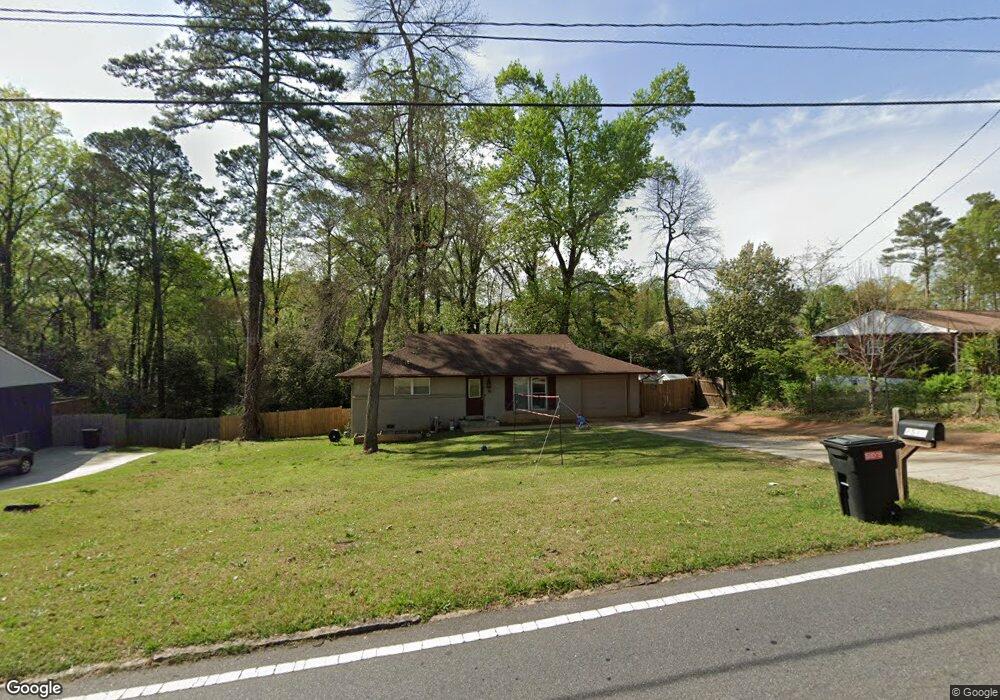
2510 Benson Poole Rd SE Smyrna, GA 30082
Southwestern Marietta NeighborhoodEstimated Value: $282,000 - $311,000
3
Beds
1
Bath
1,140
Sq Ft
$256/Sq Ft
Est. Value
About This Home
This home is located at 2510 Benson Poole Rd SE, Smyrna, GA 30082 and is currently estimated at $292,286, approximately $256 per square foot. 2510 Benson Poole Rd SE is a home located in Cobb County with nearby schools including Belmont Hills Elementary School, Griffin Middle School, and Campbell High School.
Ownership History
Date
Name
Owned For
Owner Type
Purchase Details
Closed on
Jan 2, 2008
Sold by
Bank New York
Bought by
Bonilla Gilma
Current Estimated Value
Home Financials for this Owner
Home Financials are based on the most recent Mortgage that was taken out on this home.
Original Mortgage
$56,900
Outstanding Balance
$35,566
Interest Rate
6.06%
Mortgage Type
New Conventional
Estimated Equity
$256,720
Purchase Details
Closed on
Sep 4, 2007
Sold by
Avila Francisco G
Bought by
Bank Of Ny
Purchase Details
Closed on
Nov 22, 2005
Sold by
Carwile Jack W
Bought by
Avila Francisco
Home Financials for this Owner
Home Financials are based on the most recent Mortgage that was taken out on this home.
Original Mortgage
$103,600
Interest Rate
6.1%
Mortgage Type
New Conventional
Purchase Details
Closed on
Apr 29, 2002
Sold by
Moss Katherine
Bought by
Carwile Jack W
Home Financials for this Owner
Home Financials are based on the most recent Mortgage that was taken out on this home.
Original Mortgage
$100,000
Interest Rate
7.16%
Mortgage Type
New Conventional
Create a Home Valuation Report for This Property
The Home Valuation Report is an in-depth analysis detailing your home's value as well as a comparison with similar homes in the area
Home Values in the Area
Average Home Value in this Area
Purchase History
| Date | Buyer | Sale Price | Title Company |
|---|---|---|---|
| Bonilla Gilma | $75,900 | -- | |
| Bank Of Ny | $115,000 | -- | |
| Avila Francisco | $103,600 | -- | |
| Carwile Jack W | $100,000 | -- |
Source: Public Records
Mortgage History
| Date | Status | Borrower | Loan Amount |
|---|---|---|---|
| Open | Bonilla Gilma | $56,900 | |
| Previous Owner | Avila Francisco | $103,600 | |
| Previous Owner | Carwile Jack W | $100,000 |
Source: Public Records
Tax History Compared to Growth
Tax History
| Year | Tax Paid | Tax Assessment Tax Assessment Total Assessment is a certain percentage of the fair market value that is determined by local assessors to be the total taxable value of land and additions on the property. | Land | Improvement |
|---|---|---|---|---|
| 2025 | $3,301 | $109,544 | $32,000 | $77,544 |
| 2024 | $3,303 | $109,544 | $32,000 | $77,544 |
| 2023 | $3,216 | $106,680 | $32,000 | $74,680 |
| 2022 | $1,892 | $62,328 | $32,000 | $30,328 |
| 2021 | $1,892 | $62,328 | $32,000 | $30,328 |
| 2020 | $1,948 | $64,168 | $16,000 | $48,168 |
| 2019 | $1,948 | $64,168 | $16,000 | $48,168 |
| 2018 | $1,104 | $36,388 | $10,800 | $25,588 |
| 2017 | $1,046 | $36,388 | $10,800 | $25,588 |
| 2016 | $759 | $26,408 | $8,000 | $18,408 |
| 2015 | $694 | $23,552 | $8,000 | $15,552 |
| 2014 | $688 | $23,144 | $0 | $0 |
Source: Public Records
Map
Nearby Homes
- 2041 White Cypress Ct
- 285 Windy Hill Rd SE
- 355 Benson Manor Cir SE
- 235 Still Pine Bend
- 119 Still Pine Bend
- 85 Smyrna Powder Springs Rd SE
- 2379 Olive Springs Rd SE
- 2654 Estelle Ct SE
- 33 Smyrna Powder Springs Rd SE
- 51 Overbrook Dr SE Unit 3
- 2305 Ventura Rd SE
- 2177 Wakita Dr SE
- 436 Floyd St SE
- 2275 Old Spring Rd SE
- 2618 Birch St SE
- 2675 Sandtown Rd SW
- 2831 Ivanhoe Ln SE
- 2520 Benson Poole Rd SE
- 2498 Benson Poole Rd SE
- 246 Evergreen Dr SE
- 2528 Benson Poole Rd SE
- 236 Evergreen Dr SE
- 355 Still Pine Bend
- 230 Cedar Way SE
- 359 Still Pine Bend
- 351 Still Pine Bend
- 401 Crimson Maple Way
- 226 Cedar Way SE
- 226 Evergreen Dr SE
- 347 Still Pine Bend
- 405 Crimson Maple Way
- 2538 Benson Poole Rd SE
- 2478 Benson Poole Rd SE
- 343 Still Pine Bend
- 255 Evergreen Dr SE
- 0 Evergreen Dr SE Unit 8155640
- 0 Evergreen Dr SE Unit 8890788