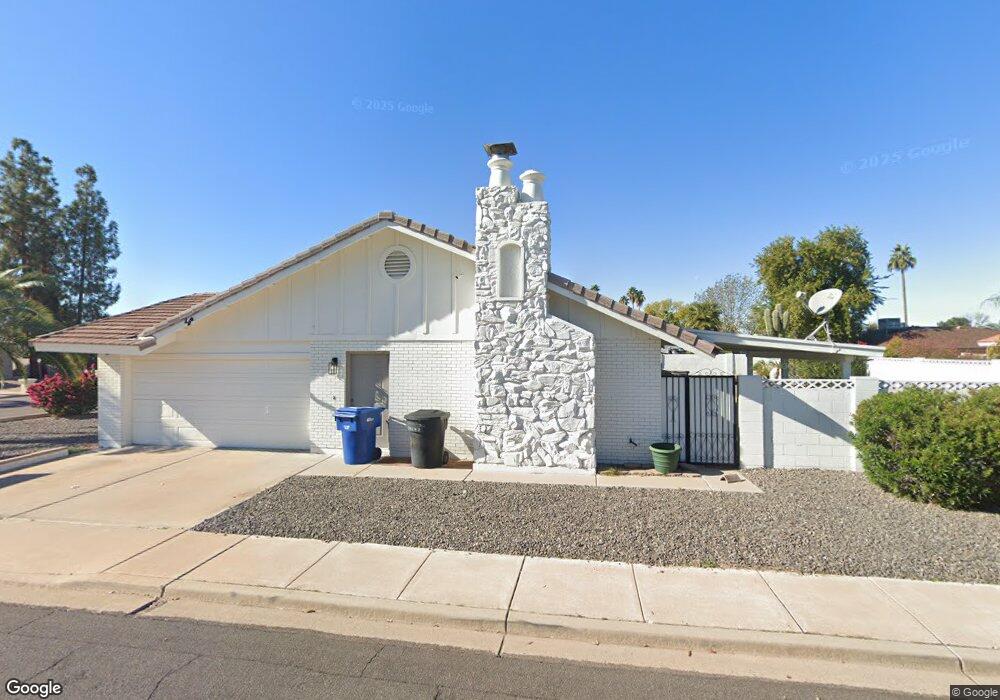
2510 E Ivyglen Cir Mesa, AZ 85213
North Central Mesa NeighborhoodEstimated Value: $577,000 - $646,000
3
Beds
2
Baths
2,318
Sq Ft
$261/Sq Ft
Est. Value
About This Home
This home is located at 2510 E Ivyglen Cir, Mesa, AZ 85213 and is currently estimated at $604,894, approximately $260 per square foot. 2510 E Ivyglen Cir is a home located in Maricopa County with nearby schools including Hale Elementary School, Franklin at Brimhall Elementary School, and Franklin West Elementary School.
Ownership History
Date
Name
Owned For
Owner Type
Purchase Details
Closed on
Jul 22, 2021
Sold by
Larson Taylor F and Hatfield Heather
Bought by
Kanund Junior N and Carroll Sarah N
Current Estimated Value
Home Financials for this Owner
Home Financials are based on the most recent Mortgage that was taken out on this home.
Original Mortgage
$452,000
Outstanding Balance
$410,120
Interest Rate
2.9%
Mortgage Type
New Conventional
Estimated Equity
$194,774
Purchase Details
Closed on
Dec 22, 2020
Sold by
The Aja Trust
Bought by
Larson Taylor F and Larson Heather
Home Financials for this Owner
Home Financials are based on the most recent Mortgage that was taken out on this home.
Original Mortgage
$350,400
Interest Rate
2.7%
Mortgage Type
New Conventional
Purchase Details
Closed on
Mar 6, 2006
Sold by
Alverson Angella J and Oliver Angella J
Bought by
Alverson Angella and The Aja Trust
Purchase Details
Closed on
Feb 23, 2005
Sold by
Wisted Nyle and Wisted June
Bought by
Oliver Angella J
Create a Home Valuation Report for This Property
The Home Valuation Report is an in-depth analysis detailing your home's value as well as a comparison with similar homes in the area
Home Values in the Area
Average Home Value in this Area
Purchase History
| Date | Buyer | Sale Price | Title Company |
|---|---|---|---|
| Kanund Junior N | $565,000 | Chicago Title Agency | |
| Larson Taylor F | $438,000 | American Title Svc Agcy Llc | |
| Alverson Angella | -- | None Available | |
| Oliver Angella J | $285,000 | Stewart Title & Trust Of Pho |
Source: Public Records
Mortgage History
| Date | Status | Borrower | Loan Amount |
|---|---|---|---|
| Open | Kanund Junior N | $452,000 | |
| Previous Owner | Larson Taylor F | $350,400 |
Source: Public Records
Tax History Compared to Growth
Tax History
| Year | Tax Paid | Tax Assessment Tax Assessment Total Assessment is a certain percentage of the fair market value that is determined by local assessors to be the total taxable value of land and additions on the property. | Land | Improvement |
|---|---|---|---|---|
| 2025 | $2,113 | $25,436 | -- | -- |
| 2024 | $2,135 | $24,225 | -- | -- |
| 2023 | $2,135 | $37,700 | $7,540 | $30,160 |
| 2022 | $2,089 | $29,550 | $5,910 | $23,640 |
| 2021 | $2,146 | $27,870 | $5,570 | $22,300 |
| 2020 | $2,117 | $25,680 | $5,130 | $20,550 |
| 2019 | $1,961 | $23,970 | $4,790 | $19,180 |
| 2018 | $1,873 | $22,250 | $4,450 | $17,800 |
| 2017 | $1,814 | $22,260 | $4,450 | $17,810 |
| 2016 | $1,781 | $20,830 | $4,160 | $16,670 |
| 2015 | $1,682 | $19,410 | $3,880 | $15,530 |
Source: Public Records
Map
Nearby Homes
- 1525 N 25th St
- 2435 E Kenwood Cir
- 2528 E Mckellips Rd Unit 74
- 2528 E Mckellips Rd Unit 146
- 2528 E Mckellips Rd Unit 15
- 2160 E Kenwood St
- 2050 N 28th Place
- 1745 N Ashbrook Cir
- 2505 E Lockwood St
- 2405 E Lynwood Cir
- 3026 E Backus Rd
- 1515 N Los Alamos Cir
- 2057 N Ashbrook
- 3041 E Backus Rd
- 2237 E Lynwood St
- 2939 E Huber St
- 3039 E Hope St
- 2015 N Los Alamos
- 3060 E Hope St
- 2353 E Brown Rd
- 2510 E Ivyglen St
- 2502 E Ivyglen St
- 2517 E Jensen St
- 2505 E Jensen St
- 2528 E Ivyglen Cir
- 2513 E Ivyglen Cir
- 2517 E Jensen Cir
- 2462 E Ivyglen St
- 2503 E Ivyglen St
- 2523 E Ivyglen Cir
- 2529 E Jensen Cir
- 2461 E Jensen St
- 2536 E Ivyglen Cir
- 2535 E Ivyglen Cir
- 2457 E Ivyglen St
- 2514 E Inglewood St
- 2452 E Ivyglen St
- 2516 E Jensen St
- 2504 E Inglewood St
- 2522 E Inglewood St