2510 N 1st St Dekalb, IL 60115
--
Bed
--
Bath
--
Sq Ft
5.72
Acres
About This Home
This home is located at 2510 N 1st St, Dekalb, IL 60115. 2510 N 1st St is a home located in DeKalb County with nearby schools including Gwendolyn Brooks Elementary School, Clinton Rosette Middle School, and De Kalb High School.
Ownership History
Date
Name
Owned For
Owner Type
Purchase Details
Closed on
Jun 25, 2021
Sold by
Mason Properties Delaware Llc
Bought by
Mason Properties 2021 Llc
Home Financials for this Owner
Home Financials are based on the most recent Mortgage that was taken out on this home.
Original Mortgage
$37,000,000
Outstanding Balance
$33,571,762
Interest Rate
2.9%
Mortgage Type
Commercial
Purchase Details
Closed on
May 12, 2014
Sold by
James Court Llc
Bought by
Mason Properties Delaware Llc
Home Financials for this Owner
Home Financials are based on the most recent Mortgage that was taken out on this home.
Original Mortgage
$33,300,000
Interest Rate
4.99%
Mortgage Type
Commercial
Purchase Details
Closed on
Jun 24, 2008
Sold by
Obk Llc
Bought by
James Court Llc
Home Financials for this Owner
Home Financials are based on the most recent Mortgage that was taken out on this home.
Original Mortgage
$41,000,000
Interest Rate
6.05%
Mortgage Type
Commercial
Create a Home Valuation Report for This Property
The Home Valuation Report is an in-depth analysis detailing your home's value as well as a comparison with similar homes in the area
Home Values in the Area
Average Home Value in this Area
Purchase History
| Date | Buyer | Sale Price | Title Company |
|---|---|---|---|
| Mason Properties 2021 Llc | -- | Greater Illinois Title | |
| Mason Properties Delaware Llc | -- | -- | |
| James Court Llc | -- | -- |
Source: Public Records
Mortgage History
| Date | Status | Borrower | Loan Amount |
|---|---|---|---|
| Open | Mason Properties 2021 Llc | $37,000,000 | |
| Closed | Mason Properties Delaware Llc | $33,300,000 | |
| Previous Owner | James Court Llc | $41,000,000 |
Source: Public Records
Tax History Compared to Growth
Tax History
| Year | Tax Paid | Tax Assessment Tax Assessment Total Assessment is a certain percentage of the fair market value that is determined by local assessors to be the total taxable value of land and additions on the property. | Land | Improvement |
|---|---|---|---|---|
| 2024 | $101,903 | $1,241,602 | $91,345 | $1,150,257 |
| 2023 | $101,903 | $1,082,572 | $79,645 | $1,002,927 |
| 2022 | $99,883 | $988,379 | $72,715 | $915,664 |
| 2021 | $102,584 | $927,011 | $68,200 | $858,811 |
| 2020 | $104,900 | $912,233 | $67,113 | $845,120 |
| 2019 | $102,841 | $876,389 | $64,476 | $811,913 |
| 2018 | $95,272 | $803,285 | $56,676 | $746,609 |
| 2017 | $96,179 | $772,166 | $54,480 | $717,686 |
| 2016 | $95,115 | $752,672 | $53,105 | $699,567 |
| 2015 | -- | $681,598 | $50,317 | $631,281 |
| 2014 | -- | $690,365 | $50,964 | $639,401 |
| 2013 | -- | $725,174 | $53,534 | $671,640 |
Source: Public Records
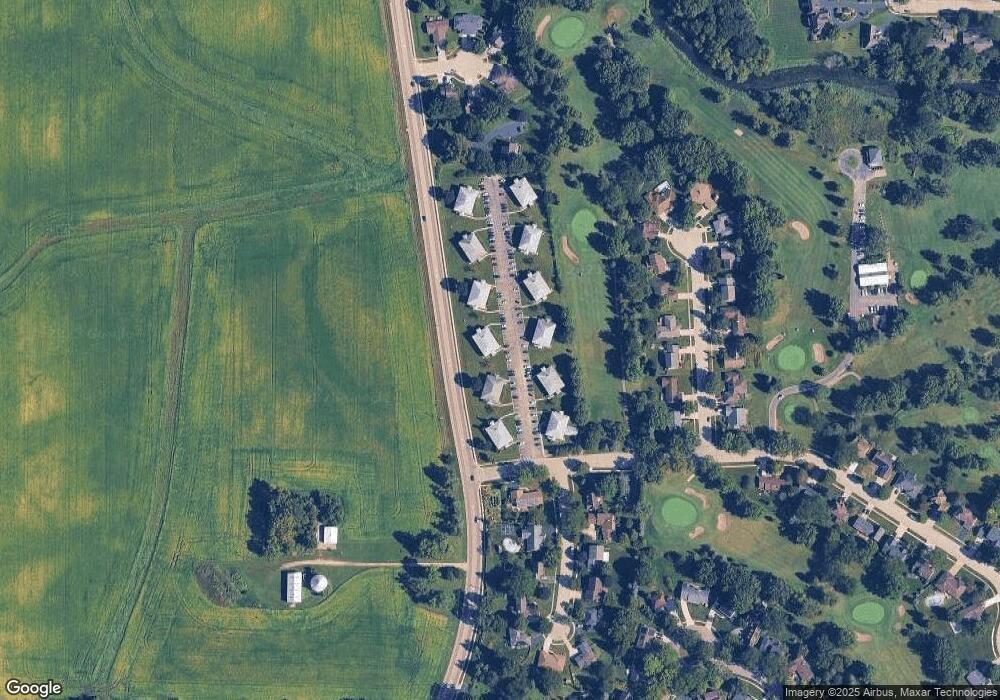
Map
Nearby Homes
- 113 Andresen Ct
- 120 Stoney Creek Rd
- 2820 N 1st St
- 301 River Dr
- 338 Greenwood N
- 111 E Royal Dr
- 141 Terrace Dr
- TBD Greenwood Acres Dr
- 3051 Fairway Oaks Dr
- 3289 Comstock Ave
- 582 W Dresser Rd
- 3323 Comstock Ave
- The Samuel Plan at Bridges of Rivermist
- The Wesley Plan at Bridges of Rivermist
- 3467 Roseman Ln
- 3229 Meadow Trail E
- 1431 Hulmes Dr
- 102 Quinlan Ave
- 584 Bayfield Dr
- 3428 Comstock Ave