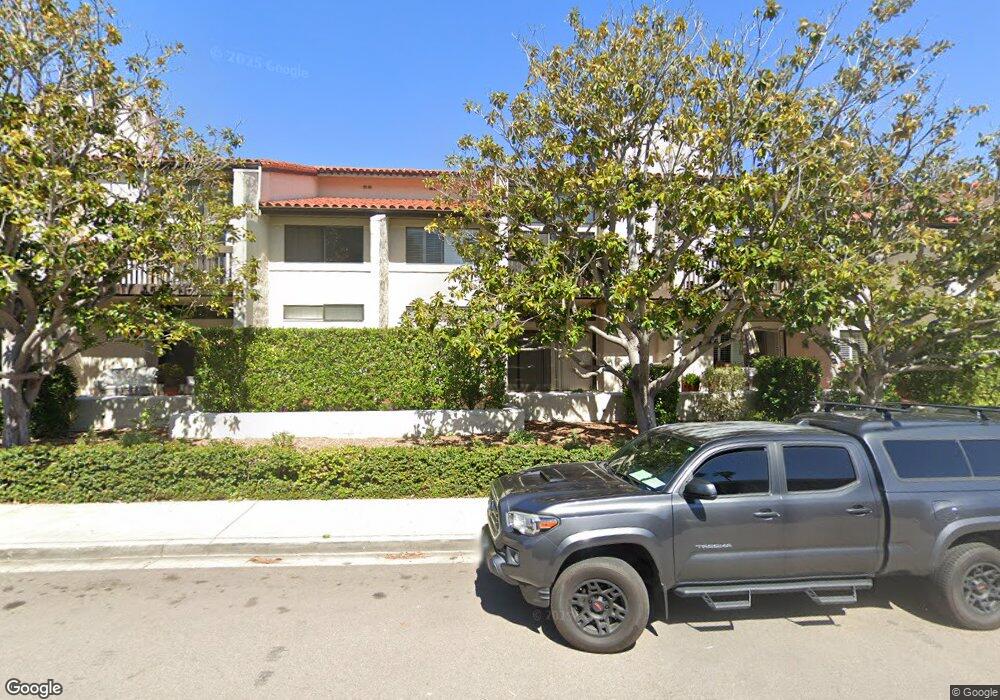
2510 Navarra Dr Unit 515 Carlsbad, CA 92009
La Costa NeighborhoodEstimated Value: $634,000 - $774,000
2
Beds
2
Baths
1,091
Sq Ft
$636/Sq Ft
Est. Value
About This Home
This home is located at 2510 Navarra Dr Unit 515, Carlsbad, CA 92009 and is currently estimated at $693,680, approximately $635 per square foot. 2510 Navarra Dr Unit 515 is a home located in San Diego County with nearby schools including La Costa Heights Elementary School, Oak Crest Middle School, and La Costa Canyon High School.
Ownership History
Date
Name
Owned For
Owner Type
Purchase Details
Closed on
Feb 28, 2018
Sold by
Carrillo Frances V and Carillo Frances V
Bought by
Carrillo Frances V
Current Estimated Value
Home Financials for this Owner
Home Financials are based on the most recent Mortgage that was taken out on this home.
Original Mortgage
$280,000
Outstanding Balance
$237,974
Interest Rate
4.04%
Mortgage Type
New Conventional
Estimated Equity
$455,706
Purchase Details
Closed on
Feb 28, 2003
Sold by
Beale Michael K and Beale Christine A
Bought by
Carillo Frances V
Home Financials for this Owner
Home Financials are based on the most recent Mortgage that was taken out on this home.
Original Mortgage
$190,400
Interest Rate
5.54%
Mortgage Type
Purchase Money Mortgage
Purchase Details
Closed on
Jun 25, 1990
Create a Home Valuation Report for This Property
The Home Valuation Report is an in-depth analysis detailing your home's value as well as a comparison with similar homes in the area
Home Values in the Area
Average Home Value in this Area
Purchase History
| Date | Buyer | Sale Price | Title Company |
|---|---|---|---|
| Carrillo Frances V | -- | First American Title | |
| Carillo Frances V | $238,000 | Chicago Title Co | |
| -- | $128,100 | -- |
Source: Public Records
Mortgage History
| Date | Status | Borrower | Loan Amount |
|---|---|---|---|
| Open | Carrillo Frances V | $280,000 | |
| Previous Owner | Carillo Frances V | $190,400 | |
| Closed | Carillo Frances V | $23,800 |
Source: Public Records
Tax History Compared to Growth
Tax History
| Year | Tax Paid | Tax Assessment Tax Assessment Total Assessment is a certain percentage of the fair market value that is determined by local assessors to be the total taxable value of land and additions on the property. | Land | Improvement |
|---|---|---|---|---|
| 2025 | $4,126 | $351,378 | $170,895 | $180,483 |
| 2024 | $4,126 | $344,490 | $167,545 | $176,945 |
| 2023 | $3,983 | $337,736 | $164,260 | $173,476 |
| 2022 | $3,871 | $331,115 | $161,040 | $170,075 |
| 2021 | $3,789 | $324,624 | $157,883 | $166,741 |
| 2020 | $3,711 | $321,297 | $156,265 | $165,032 |
| 2019 | $3,641 | $314,998 | $153,201 | $161,797 |
| 2018 | $3,512 | $302,941 | $150,198 | $152,743 |
| 2017 | $3,453 | $297,002 | $147,253 | $149,749 |
| 2016 | $3,351 | $291,179 | $144,366 | $146,813 |
| 2015 | $3,277 | $286,806 | $142,198 | $144,608 |
| 2014 | $3,073 | $270,000 | $133,000 | $137,000 |
Source: Public Records
Map
Nearby Homes
- 2508 Navarra Dr Unit 424
- 2506 Navarra Dr Unit 618
- 2507 Navarra Dr Unit 202
- 2533 Navarra Dr Unit 2A
- 2537 Navarra Dr Unit B9
- 7500 Viejo Castilla Way Unit 9
- 2552 Navarra Dr Unit A
- 2630 Pirineos Way Unit 4
- 2630 Pirineos Way Unit 14
- 2639 Pirineos Way Unit 231
- 2606 Galicia Way
- 2916 Avenida Valera
- 7508 Jerez Ct
- 2433 La Costa Ave Unit A
- 7394 Altiva Place
- 2348 La Costa Ave Unit 202
- 2402 Altisma Way Unit G
- 2412 Altisma Way Unit D
- 2388 Altisma Way Unit 10
- 7359 Alicante Rd
- 2506 Navarra Dr
- 2510 Navarra Dr
- 2506 Navarra Dr Unit 616
- 2510 Navarra Dr Unit 526
- 2510 Navarra Dr Unit 525
- 2510 Navarra Dr Unit 524
- 2510 Navarra Dr Unit 523
- 2510 Navarra Dr Unit 522
- 2510 Navarra Dr Unit 521
- 2510 Navarra Dr Unit 516
- 2510 Navarra Dr Unit 514
- 2510 Navarra Dr Unit 513
- 2510 Navarra Dr Unit 512
- 2510 Navarra Dr Unit 511
- 2510 Navarra Dr Unit 505
- 2510 Navarra Dr Unit 504
- 2510 Navarra Dr Unit 503
- 2506 Navarra Dr Unit 628
- 2506 Navarra Dr Unit 627
- 2506 Navarra Dr Unit 626