Estimated Value: $556,249 - $573,000
1
Bed
1
Bath
630
Sq Ft
$900/Sq Ft
Est. Value
About This Home
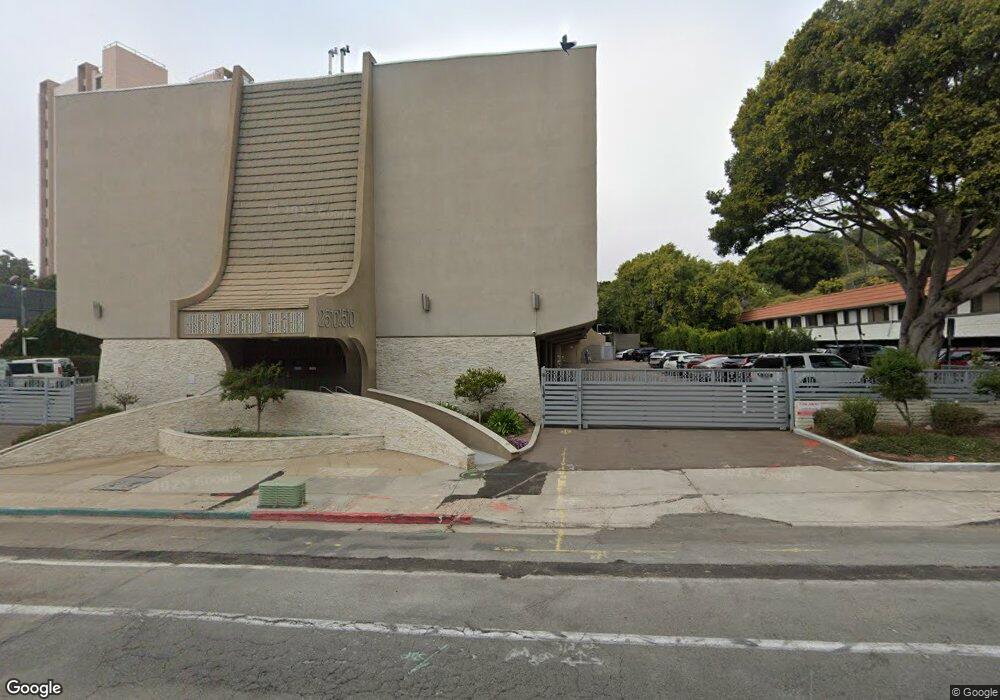
This home is located at 2510 Torrey Pines Rd Unit 205, La Jolla, CA 92037 and is currently estimated at $567,312, approximately $900 per square foot. 2510 Torrey Pines Rd Unit 205 is a home located in San Diego County with nearby schools including Torrey Pines Elementary School, Muirlands Middle School, and La Jolla High School.
Ownership History
Date
Name
Owned For
Owner Type
Purchase Details
Closed on
Mar 8, 2018
Sold by
Allen Linda Issa
Bought by
Cherry Trenton Keith and Allen Linda Issa
Current Estimated Value
Purchase Details
Closed on
Jun 17, 2013
Sold by
Bamhart Jordan M
Bought by
Allen Linda Issa
Purchase Details
Closed on
Apr 14, 2010
Sold by
Barnhart Mariah
Bought by
Barnhart Jordan
Home Financials for this Owner
Home Financials are based on the most recent Mortgage that was taken out on this home.
Original Mortgage
$218,601
Interest Rate
4.91%
Mortgage Type
VA
Purchase Details
Closed on
Mar 8, 2010
Sold by
Chylinski Richard J and Chylinski Kathleen
Bought by
Barnhart Jordan M
Home Financials for this Owner
Home Financials are based on the most recent Mortgage that was taken out on this home.
Original Mortgage
$218,601
Interest Rate
4.91%
Mortgage Type
VA
Purchase Details
Closed on
Nov 1, 1988
Purchase Details
Closed on
Nov 18, 1987
Create a Home Valuation Report for This Property
The Home Valuation Report is an in-depth analysis detailing your home's value as well as a comparison with similar homes in the area
Home Values in the Area
Average Home Value in this Area
Purchase History
| Date | Buyer | Sale Price | Title Company |
|---|---|---|---|
| Cherry Trenton Keith | -- | None Available | |
| Allen Linda Issa | $227,500 | Lawyers Title Company | |
| Barnhart Jordan | -- | Lawyers Title Sd | |
| Barnhart Jordan M | $214,000 | Lawyers Title Sd | |
| -- | $78,800 | -- | |
| -- | $70,000 | -- |
Source: Public Records
Mortgage History
| Date | Status | Borrower | Loan Amount |
|---|---|---|---|
| Previous Owner | Barnhart Jordan | $218,601 | |
| Previous Owner | Barnhart Jordan M | $218,601 |
Source: Public Records
Tax History Compared to Growth
Tax History
| Year | Tax Paid | Tax Assessment Tax Assessment Total Assessment is a certain percentage of the fair market value that is determined by local assessors to be the total taxable value of land and additions on the property. | Land | Improvement |
|---|---|---|---|---|
| 2025 | $4,827 | $398,236 | $341,347 | $56,889 |
| 2024 | $4,827 | $390,428 | $334,654 | $55,774 |
| 2023 | $4,720 | $382,774 | $328,093 | $54,681 |
| 2022 | $4,595 | $375,269 | $321,660 | $53,609 |
| 2021 | $4,564 | $367,911 | $315,353 | $52,558 |
| 2020 | $4,509 | $364,140 | $312,120 | $52,020 |
| 2019 | $4,429 | $357,000 | $306,000 | $51,000 |
| 2018 | $2,909 | $245,096 | $122,548 | $122,548 |
| 2017 | $2,840 | $240,292 | $120,146 | $120,146 |
| 2016 | $2,794 | $235,582 | $117,791 | $117,791 |
| 2015 | $2,754 | $232,044 | $116,022 | $116,022 |
| 2014 | $2,711 | $227,500 | $113,750 | $113,750 |
Source: Public Records
About This Building
Map
Nearby Homes
- 2510 Torrey Pines Rd
- 2510 Torrey Pines Unit 415
- 2510 Torrey Pines Unit 212
- 2500 Torrey Pines Rd Unit 305
- 2500 Torrey Pines Rd Unit 902
- 2500 Torrey Pines Rd Unit 805
- 2600 Torrey Pines Rd Unit A13
- 2684 Costebelle Dr
- 2894 Torrey Pines Rd Unit LU21
- 2136 Paseo Dorado
- 2134 Paseo Dorado
- 7713 Esterel Dr
- 7778 Starlight Dr
- 8305 Calle Del Cielo
- 7850 Roseland Dr
- 8260 Paseo Del Ocaso
- 8390 Prestwick Dr
- 8430 Whale Watch Way
- 7835 La Jolla Vista Dr
- 8504 Prestwick Dr
- 2510 Torrey Pines Rd Unit La Jolla Shores Cond
- 2510 Torrey Pines Rd Unit Z
- 2510 Torrey Pines Rd
- 2510 Torrey Pines Rd Unit 317
- 2510 Torrey Pines Rd Unit 308
- 2510 Torrey Pines Rd Unit 306
- 2510 Torrey Pines Rd Unit 304
- 2510 Torrey Pines Rd Unit 302
- 2510 Torrey Pines Rd Unit 201
- 2510 Torrey Pines Rd Unit 203
- 2510 Torrey Pines Rd Unit 207
- 2510 Torrey Pines Rd Unit 209
- 2510 Torrey Pines Rd Unit 211
- 2510 Torrey Pines Rd Unit 215
- 2510 Torrey Pines Rd Unit 217
- 2510 Torrey Pines Rd Unit 220
- 2510 Torrey Pines Rd Unit 218
- 2510 Torrey Pines Rd Unit 216
- 2510 Torrey Pines Rd Unit 214
- 2510 Torrey Pines Rd Unit 311