Estimated Value: $526,000 - $571,000
1
Bed
1
Bath
631
Sq Ft
$866/Sq Ft
Est. Value
About This Home
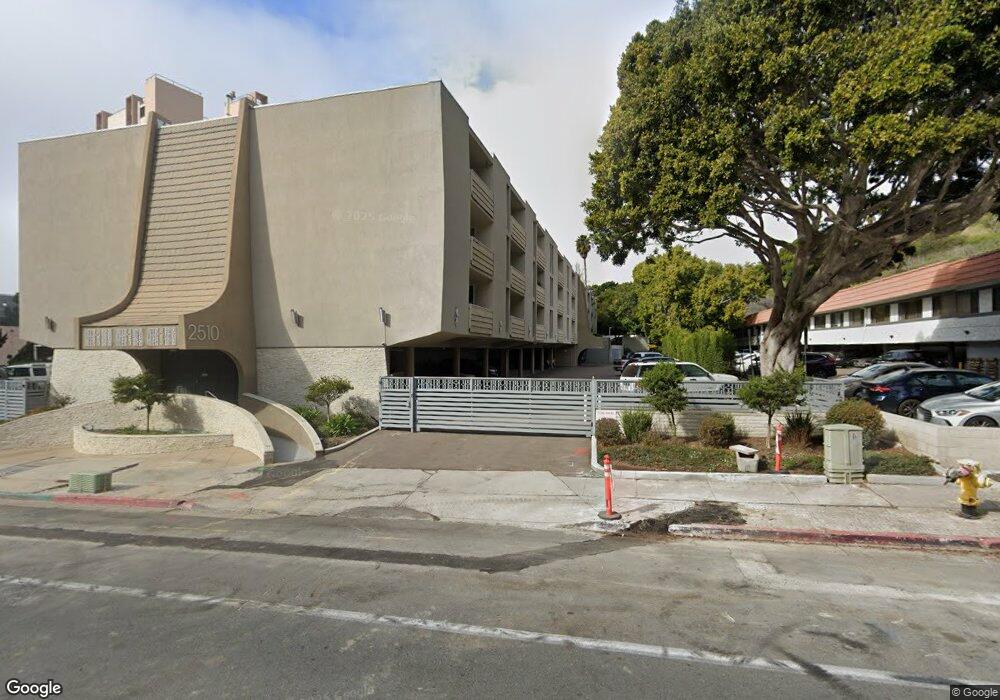
This home is located at 2510 Torrey Pines Rd Unit 302, La Jolla, CA 92037 and is currently estimated at $546,200, approximately $865 per square foot. 2510 Torrey Pines Rd Unit 302 is a home located in San Diego County with nearby schools including Torrey Pines Elementary School, Muirlands Middle School, and La Jolla High School.
Ownership History
Date
Name
Owned For
Owner Type
Purchase Details
Closed on
Jul 8, 2014
Sold by
Cosby Theodore Earle
Bought by
Cosby Theodore Earle and Cosby Ming Lan Wei
Current Estimated Value
Purchase Details
Closed on
Apr 30, 1998
Sold by
Gold Theodore
Bought by
Cosby Theodore Earle
Home Financials for this Owner
Home Financials are based on the most recent Mortgage that was taken out on this home.
Original Mortgage
$74,700
Outstanding Balance
$14,634
Interest Rate
7.13%
Mortgage Type
Purchase Money Mortgage
Estimated Equity
$531,566
Purchase Details
Closed on
Apr 29, 1998
Sold by
Gold Theodore Trust 08-29-91 and Theodore
Bought by
Gold Theodore
Home Financials for this Owner
Home Financials are based on the most recent Mortgage that was taken out on this home.
Original Mortgage
$74,700
Outstanding Balance
$14,634
Interest Rate
7.13%
Mortgage Type
Purchase Money Mortgage
Estimated Equity
$531,566
Purchase Details
Closed on
Aug 10, 1987
Create a Home Valuation Report for This Property
The Home Valuation Report is an in-depth analysis detailing your home's value as well as a comparison with similar homes in the area
Home Values in the Area
Average Home Value in this Area
Purchase History
| Date | Buyer | Sale Price | Title Company |
|---|---|---|---|
| Cosby Theodore Earle | -- | None Available | |
| Cosby Theodore Earle | $83,000 | South Coast Title Company | |
| Gold Theodore | -- | South Coast Title Company | |
| -- | $75,000 | -- |
Source: Public Records
Mortgage History
| Date | Status | Borrower | Loan Amount |
|---|---|---|---|
| Open | Cosby Theodore Earle | $74,700 |
Source: Public Records
Tax History Compared to Growth
Tax History
| Year | Tax Paid | Tax Assessment Tax Assessment Total Assessment is a certain percentage of the fair market value that is determined by local assessors to be the total taxable value of land and additions on the property. | Land | Improvement |
|---|---|---|---|---|
| 2025 | $1,541 | $132,499 | $70,669 | $61,830 |
| 2024 | $1,541 | $129,902 | $69,284 | $60,618 |
| 2023 | $1,505 | $127,356 | $67,926 | $59,430 |
| 2022 | $1,464 | $124,860 | $66,595 | $58,265 |
| 2021 | $1,452 | $122,413 | $65,290 | $57,123 |
| 2020 | $1,434 | $121,159 | $64,621 | $56,538 |
| 2019 | $1,408 | $118,784 | $63,354 | $55,430 |
| 2018 | $1,316 | $116,456 | $62,112 | $54,344 |
| 2017 | $1,283 | $114,174 | $60,895 | $53,279 |
| 2016 | $1,260 | $111,936 | $59,701 | $52,235 |
| 2015 | $1,241 | $110,256 | $58,805 | $51,451 |
| 2014 | $1,221 | $108,098 | $57,654 | $50,444 |
Source: Public Records
About This Building
Map
Nearby Homes
- 2510 Torrey Pines Unit 415
- 2510 Torrey Pines Unit 212
- 2500 Torrey Pines Rd Unit 305
- 2500 Torrey Pines Rd Unit 902
- 2500 Torrey Pines Rd Unit 805
- 2600 Torrey Pines Rd Unit A31
- 2600 Torrey Pines Rd Unit A25
- 2630 Torrey Pines Rd Unit E22
- 7981 Caminito Del Cid
- 2684 Costebelle Dr
- 2842 Torrey Pines Rd
- 8031 La Jolla Shores Dr
- 7713 Esterel Dr
- 2136 Paseo Dorado
- 2134 Paseo Dorado
- 7940 La Jolla Shores Dr
- 7716 Hidden Valley Ct
- 7778 Starlight Dr
- 7850 Roseland Dr
- 2210 Avenida de la Playa
- 2510 Torrey Pines Rd Unit La Jolla Shores Cond
- 2510 Torrey Pines Rd Unit Z
- 2510 Torrey Pines Rd
- 2510 Torrey Pines Rd
- 2510 Torrey Pines Rd Unit 317
- 2510 Torrey Pines Rd Unit 308
- 2510 Torrey Pines Rd Unit 306
- 2510 Torrey Pines Rd Unit 304
- 2510 Torrey Pines Rd Unit 201
- 2510 Torrey Pines Rd Unit 203
- 2510 Torrey Pines Rd Unit 205
- 2510 Torrey Pines Rd Unit 207
- 2510 Torrey Pines Rd Unit 209
- 2510 Torrey Pines Rd Unit 211
- 2510 Torrey Pines Rd Unit 215
- 2510 Torrey Pines Rd Unit 217
- 2510 Torrey Pines Rd Unit 220
- 2510 Torrey Pines Rd Unit 218
- 2510 Torrey Pines Rd Unit 216
- 2510 Torrey Pines Rd Unit 214