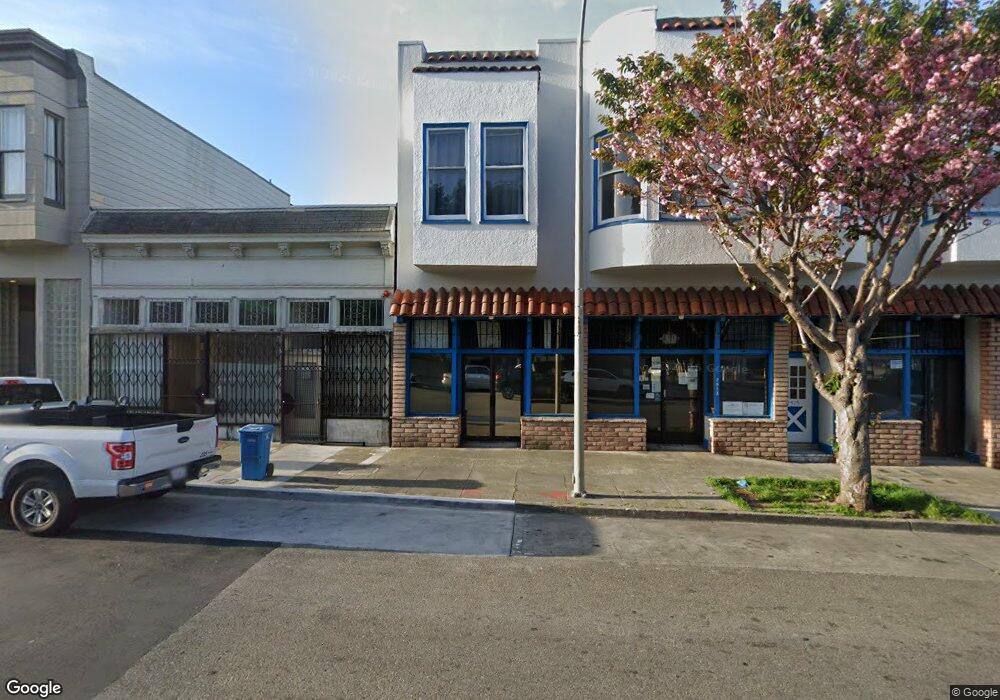
2511 24th St San Francisco, CA 94110
Inner Mission NeighborhoodEstimated Value: $2,318,464
7
Beds
5
Baths
6,200
Sq Ft
$374/Sq Ft
Est. Value
About This Home
This home is located at 2511 24th St, San Francisco, CA 94110 and is currently estimated at $2,318,464, approximately $373 per square foot. 2511 24th St is a home located in San Francisco County with nearby schools including Bryant Elementary, Everett Middle School, and Mission Preparatory.
Ownership History
Date
Name
Owned For
Owner Type
Purchase Details
Closed on
Sep 5, 2019
Sold by
Lippi Steven Richard and Lippi Ida Anna
Bought by
Seneca Family Of Agencies
Current Estimated Value
Purchase Details
Closed on
Dec 26, 2018
Sold by
Del Carlo Investments Llc
Bought by
Lippi Steven Richard and Lippi Ida Anna
Purchase Details
Closed on
Dec 20, 2016
Sold by
Delcarlo Damel A and Delcarlo Del Carlo
Bought by
Dp Investments Llc
Purchase Details
Closed on
Dec 16, 2016
Sold by
Brunamonti Francesco and Brunamonti Denise
Bought by
Brunamonti Llc
Purchase Details
Closed on
Dec 15, 2015
Sold by
Fj Investments Lp
Bought by
Del Carlo Investments Llc
Purchase Details
Closed on
Feb 28, 1995
Sold by
Delcarlo Jean and Lippi Anna
Bought by
Fj Investments Lp
Purchase Details
Closed on
Dec 27, 1994
Sold by
Delcarlo Jean
Bought by
Lippi Anna and Lippi Steven R
Create a Home Valuation Report for This Property
The Home Valuation Report is an in-depth analysis detailing your home's value as well as a comparison with similar homes in the area
Home Values in the Area
Average Home Value in this Area
Purchase History
| Date | Buyer | Sale Price | Title Company |
|---|---|---|---|
| Seneca Family Of Agencies | $2,500,000 | Old Republic Title Co | |
| Lippi Steven Richard | -- | None Available | |
| Dp Investments Llc | -- | None Available | |
| Brunamonti Llc | -- | None Available | |
| Del Carlo Investments Llc | -- | None Available | |
| Del Carlo Investments Llc | -- | None Available | |
| Fj Investments Lp | -- | -- | |
| Lippi Anna | -- | -- | |
| Delcarlo Jean | -- | -- |
Source: Public Records
Tax History Compared to Growth
Tax History
| Year | Tax Paid | Tax Assessment Tax Assessment Total Assessment is a certain percentage of the fair market value that is determined by local assessors to be the total taxable value of land and additions on the property. | Land | Improvement |
|---|---|---|---|---|
| 2025 | $11,939 | $2,849,689 | $1,913,879 | $820,233 |
| 2024 | $11,939 | $2,804,779 | $1,876,352 | $804,150 |
| 2023 | $11,624 | $2,759,737 | $1,839,561 | $788,383 |
| 2022 | $11,354 | $2,683,700 | $1,803,492 | $772,925 |
| 2021 | $11,156 | $2,557,430 | $1,768,130 | $789,300 |
| 2020 | $15,280 | $2,500,000 | $1,750,000 | $750,000 |
| 2019 | $3,616 | $200,789 | $81,164 | $119,625 |
| 2018 | $3,531 | $196,821 | $79,559 | $117,262 |
| 2017 | $3,197 | $192,965 | $78,000 | $114,965 |
| 2016 | $3,106 | $189,270 | $76,516 | $112,754 |
| 2015 | $3,059 | $186,428 | $75,367 | $111,061 |
| 2014 | $2,989 | $182,777 | $73,891 | $108,886 |
Source: Public Records
Map
Nearby Homes
- 1354 Utah St Unit 1354
- 2603 23rd St
- 2250 24th St Unit 127
- 1338 Rhode Island St
- 2225 23rd St Unit 214
- 2758 23rd St
- 2758-2760 23rd St
- 1258 York St
- 1225 Rhode Island St
- 1222 York St Unit C
- 1222 York St Unit A
- 1104 York St
- 2920 25th St
- 1339-1341 York St
- 2926 25th St
- 2922 25th St
- 2816 23rd St
- 2893 24th St
- 2119 22nd St
- 1013 Rhode Island St
- 2525 24th St
- 1320 San Bruno Ave
- 1326 San Bruno Ave Unit 1328
- 1330 San Bruno Ave Unit 1334
- 1303 Utah St
- 1336 San Bruno Ave Unit 1338
- 1307 Utah St Unit 1309
- 2445 24th St
- 1319 San Bruno Ave
- 1315 Utah St
- 1342 San Bruno Ave
- 1285 San Bruno Ave Unit 1287
- 2437 24th St Unit 2441
- 1317 Utah St
- 1319 Utah St
- 1346 San Bruno Ave
- 2431 24th St
- 1325 San Bruno Ave
- 2444 24th St
- 2440 24th St Unit 2444