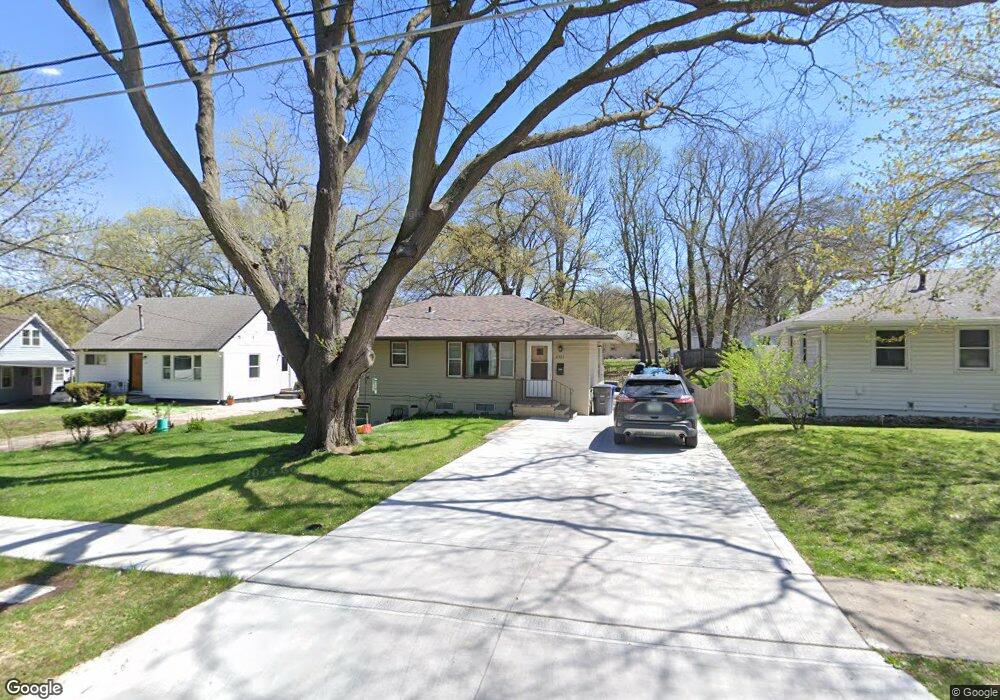
2511 27th St Des Moines, IA 50310
Doudna Heights-Glen Oaks NeighborhoodEstimated Value: $136,000 - $233,606
3
Beds
2
Baths
864
Sq Ft
$214/Sq Ft
Est. Value
About This Home
This home is located at 2511 27th St, Des Moines, IA 50310 and is currently estimated at $184,803, approximately $213 per square foot. 2511 27th St is a home located in Polk County with nearby schools including Monroe Elementary School, Meredith Middle School, and Hoover High School.
Ownership History
Date
Name
Owned For
Owner Type
Purchase Details
Closed on
May 10, 2006
Sold by
Culbertson Christopher M and Culbertson Kayce
Bought by
Tran Cong and Ho Hien
Current Estimated Value
Home Financials for this Owner
Home Financials are based on the most recent Mortgage that was taken out on this home.
Original Mortgage
$96,800
Outstanding Balance
$56,586
Interest Rate
6.66%
Mortgage Type
Commercial
Estimated Equity
$128,217
Purchase Details
Closed on
Nov 6, 1998
Sold by
Cuomo Andrew M
Bought by
Rhoades James D
Home Financials for this Owner
Home Financials are based on the most recent Mortgage that was taken out on this home.
Original Mortgage
$51,473
Interest Rate
6.59%
Mortgage Type
FHA
Purchase Details
Closed on
Aug 17, 1998
Sold by
Principal Residential Mtg Inc
Bought by
Hud
Purchase Details
Closed on
Oct 9, 1997
Sold by
Rice Bob E
Bought by
Principal Residential Mtg Inc
Create a Home Valuation Report for This Property
The Home Valuation Report is an in-depth analysis detailing your home's value as well as a comparison with similar homes in the area
Home Values in the Area
Average Home Value in this Area
Purchase History
| Date | Buyer | Sale Price | Title Company |
|---|---|---|---|
| Tran Cong | $120,500 | None Available | |
| Rhoades James D | -- | -- | |
| Hud | $47,000 | -- | |
| Principal Residential Mtg Inc | $47,103 | -- |
Source: Public Records
Mortgage History
| Date | Status | Borrower | Loan Amount |
|---|---|---|---|
| Open | Tran Cong | $96,800 | |
| Previous Owner | Rhoades James D | $51,473 |
Source: Public Records
Tax History Compared to Growth
Tax History
| Year | Tax Paid | Tax Assessment Tax Assessment Total Assessment is a certain percentage of the fair market value that is determined by local assessors to be the total taxable value of land and additions on the property. | Land | Improvement |
|---|---|---|---|---|
| 2025 | $3,186 | $190,900 | $39,800 | $151,100 |
| 2024 | $3,186 | $172,400 | $35,800 | $136,600 |
| 2023 | $3,032 | $172,400 | $35,800 | $136,600 |
| 2022 | $3,006 | $137,500 | $29,900 | $107,600 |
| 2021 | $2,844 | $137,500 | $29,900 | $107,600 |
| 2020 | $2,950 | $122,600 | $26,400 | $96,200 |
| 2019 | $2,618 | $122,600 | $26,400 | $96,200 |
| 2018 | $2,586 | $105,900 | $22,300 | $83,600 |
| 2017 | $2,314 | $105,900 | $22,300 | $83,600 |
| 2016 | $2,250 | $94,100 | $19,400 | $74,700 |
| 2015 | $2,250 | $94,100 | $19,400 | $74,700 |
| 2014 | $2,046 | $85,700 | $17,500 | $68,200 |
Source: Public Records
Map
Nearby Homes
- 2701 27th St
- 2730 Sheridan Ave
- 2515 24th St
- 2523 Prospect Rd
- 2742 Hickman Rd
- 2315 Holcomb Ave
- 2823 Holcomb Ave
- 2620 Arnold Rd
- 2615 30th St
- 2715 Allison Ave
- 2104 23rd St
- 3109 Holcomb Ave
- 00 24th St
- 2413 Adams Ave
- 3112 Sheridan Ave
- 2516 Boston Ave
- 2014 23rd St
- 2513 33rd St
- 2804 Boston Ave
- 3111 Lincoln Ave