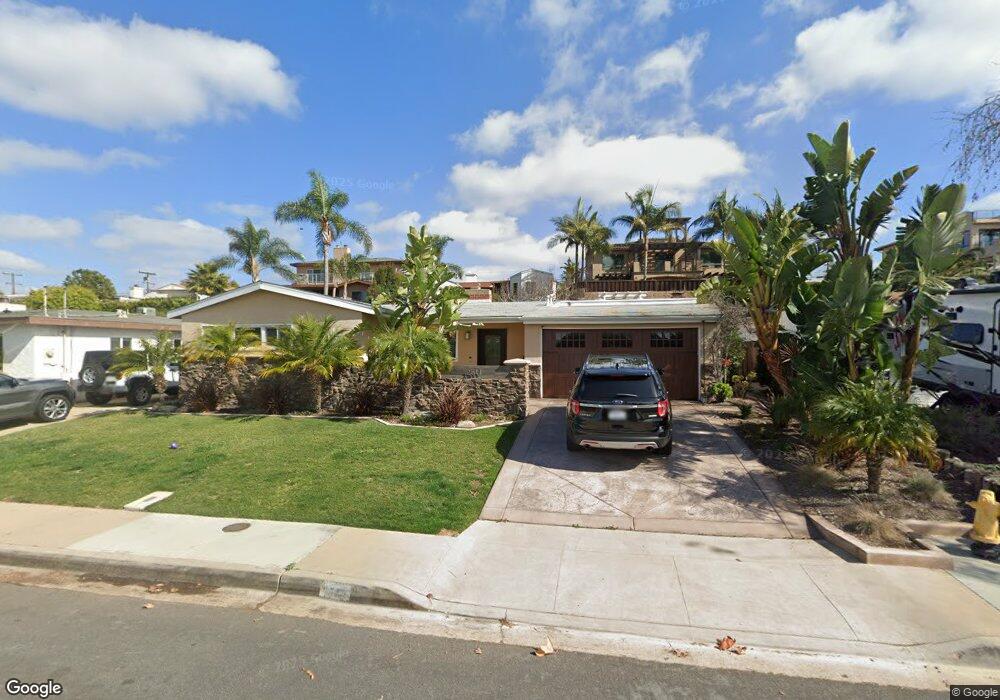
2511 Burgener Blvd San Diego, CA 92110
Bay Park NeighborhoodEstimated Value: $1,667,000 - $1,762,000
4
Beds
2
Baths
1,921
Sq Ft
$899/Sq Ft
Est. Value
About This Home
This home is located at 2511 Burgener Blvd, San Diego, CA 92110 and is currently estimated at $1,726,710, approximately $898 per square foot. 2511 Burgener Blvd is a home located in San Diego County with nearby schools including Bay Park Elementary School, Marston Middle School, and Clairemont High School.
Ownership History
Date
Name
Owned For
Owner Type
Purchase Details
Closed on
Feb 18, 2017
Sold by
Halecky Daniel and Halecky Breanne
Bought by
Halecky Daniel A and Halecky Breanne
Current Estimated Value
Purchase Details
Closed on
Dec 28, 2011
Sold by
Sdpb Holdings Llc
Bought by
Halecky Daniel and Halecky Breanne
Home Financials for this Owner
Home Financials are based on the most recent Mortgage that was taken out on this home.
Original Mortgage
$496,000
Outstanding Balance
$339,718
Interest Rate
3.96%
Mortgage Type
New Conventional
Estimated Equity
$1,386,992
Purchase Details
Closed on
Aug 15, 2011
Sold by
Page Mary Fern
Bought by
Sdpb Holdings Llc
Home Financials for this Owner
Home Financials are based on the most recent Mortgage that was taken out on this home.
Original Mortgage
$212,500
Interest Rate
4.48%
Mortgage Type
Purchase Money Mortgage
Purchase Details
Closed on
May 30, 2008
Sold by
Denison George R
Bought by
Denison George R
Purchase Details
Closed on
Dec 3, 1998
Sold by
Denison George R
Bought by
Denison George R
Create a Home Valuation Report for This Property
The Home Valuation Report is an in-depth analysis detailing your home's value as well as a comparison with similar homes in the area
Home Values in the Area
Average Home Value in this Area
Purchase History
| Date | Buyer | Sale Price | Title Company |
|---|---|---|---|
| Halecky Daniel A | -- | None Available | |
| Halecky Daniel | $620,000 | Stewart Title Company | |
| Sdpb Holdings Llc | $425,000 | Stewart Title Company | |
| Denison George R | -- | None Available | |
| Denison George R | -- | -- | |
| Purdom Corinne | -- | -- |
Source: Public Records
Mortgage History
| Date | Status | Borrower | Loan Amount |
|---|---|---|---|
| Open | Halecky Daniel | $496,000 | |
| Previous Owner | Sdpb Holdings Llc | $212,500 |
Source: Public Records
Tax History Compared to Growth
Tax History
| Year | Tax Paid | Tax Assessment Tax Assessment Total Assessment is a certain percentage of the fair market value that is determined by local assessors to be the total taxable value of land and additions on the property. | Land | Improvement |
|---|---|---|---|---|
| 2025 | $9,325 | $778,740 | $549,702 | $229,038 |
| 2024 | $9,325 | $763,472 | $538,924 | $224,548 |
| 2023 | $9,118 | $748,503 | $528,357 | $220,146 |
| 2022 | $8,874 | $733,828 | $517,998 | $215,830 |
| 2021 | $8,811 | $719,441 | $507,842 | $211,599 |
| 2020 | $8,704 | $712,065 | $502,635 | $209,430 |
| 2019 | $8,547 | $698,104 | $492,780 | $205,324 |
| 2018 | $7,989 | $684,417 | $483,118 | $201,299 |
| 2017 | $7,798 | $670,998 | $473,646 | $197,352 |
| 2016 | $7,672 | $657,842 | $464,359 | $193,483 |
| 2015 | $7,558 | $647,961 | $457,384 | $190,577 |
| 2014 | $7,438 | $635,269 | $448,425 | $186,844 |
Source: Public Records
Map
Nearby Homes
- 2585 Cowley Way
- 2628 Grandview St
- 2711 Deerpark Dr
- 2190 Penrose St
- 2802 Cowley Way
- 4770 Jellett St
- 2851 Grandview St
- 4850 Field St
- 4931 Southcrest Ave
- 2812 Hartford Ct
- 4542 Milton St
- 2930 Cowley Way Unit 211
- 6328-30 Quillan St
- 4436 Lister St
- 2113 Frankfort St
- 4603 Huron Ave
- 5360 Burford St
- 2630 Erie St Unit 16
- 2525 Inman Ct
- 6317 Caminito Del Pastel
- 2505 Burgener Blvd
- 2519 Burgener Blvd
- 2510 Deerpark Dr
- 2504 Deerpark Dr
- 2457 Burgener Blvd
- 2525 Burgener Blvd
- 2516 Deerpark Dr
- 2458 Deerpark Dr
- 2510 Burgener Blvd
- 2449 Burgener Blvd
- 2516 Burgener Blvd
- 2531 Burgener Blvd
- 2504 Burgener Blvd
- 2452 Deerpark Dr
- 2522 Burgener Blvd
- 2528 Deerpark Dr
- 2443 Burgener Blvd
- 2528 Burgener Blvd
- 2537 Burgener Blvd
- 2450 Burgener Blvd