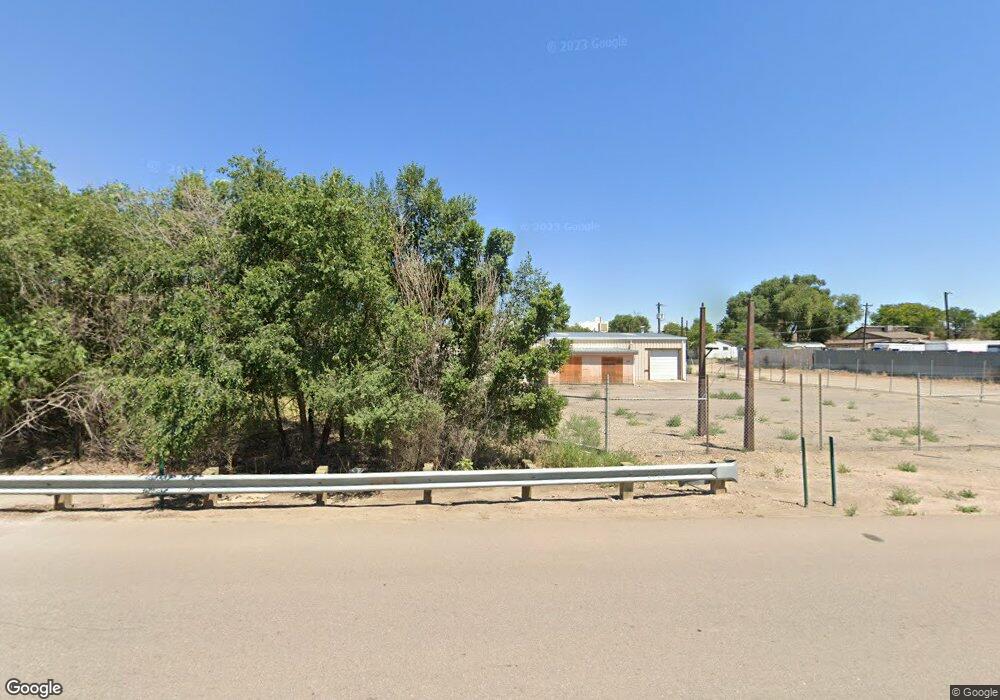
2511 E 4th St Pueblo, CO 81001
East Side NeighborhoodEstimated Value: $497,270
Studio
--
Bath
8,076
Sq Ft
$62/Sq Ft
Est. Value
About This Home
This home is located at 2511 E 4th St, Pueblo, CO 81001 and is currently estimated at $497,270, approximately $61 per square foot. 2511 E 4th St is a home located in Pueblo County with nearby schools including Baca Elementary School, Risley International Academy of Innovation, and East High School.
Ownership History
Date
Name
Owned For
Owner Type
Purchase Details
Closed on
Jun 14, 2022
Sold by
Reed Almond E
Bought by
Brick Solid Investments Llc
Current Estimated Value
Purchase Details
Closed on
May 13, 2022
Sold by
Reed Janice M
Bought by
Reed Almond E
Purchase Details
Closed on
Jun 2, 2021
Sold by
Reed Almond E
Bought by
Reed Almond E and Kowalski Christina
Purchase Details
Closed on
May 10, 2021
Sold by
Reed Janice M
Bought by
Reed Almond E
Purchase Details
Closed on
Mar 9, 2012
Sold by
Reed Janice M
Bought by
Reed Almond E
Purchase Details
Closed on
Aug 2, 1995
Sold by
Ohrdorf Larry K + Lynne
Bought by
Reed Almond E + Janice M
Purchase Details
Closed on
Nov 5, 1985
Sold by
Intrawest Bank Of Pueblo
Bought by
Ohrdorf Larry K + Lynne
Purchase Details
Closed on
Dec 26, 1984
Sold by
Foster R B + Mary
Bought by
Intrawest Bank Of Pueblo
Purchase Details
Closed on
Jan 21, 1970
Sold by
Whaley H Boyd + Alma
Bought by
Foster R B + Mary
Create a Home Valuation Report for This Property
The Home Valuation Report is an in-depth analysis detailing your home's value as well as a comparison with similar homes in the area
Home Values in the Area
Average Home Value in this Area
Purchase History
| Date | Buyer | Sale Price | Title Company |
|---|---|---|---|
| Brick Solid Investments Llc | $515,000 | Land Title | |
| Reed Almond E | -- | None Listed On Document | |
| Reed Almond E | -- | None Listed On Document | |
| Reed Almond E | -- | None Available | |
| Reed Almond E | -- | None Available | |
| Reed Almond E + Janice M | $145,000 | -- | |
| Ohrdorf Larry K + Lynne | $12,000 | -- | |
| Intrawest Bank Of Pueblo | $5,500 | -- | |
| Foster R B + Mary | $5,500 | -- |
Source: Public Records
Tax History
| Year | Tax Paid | Tax Assessment Tax Assessment Total Assessment is a certain percentage of the fair market value that is determined by local assessors to be the total taxable value of land and additions on the property. | Land | Improvement |
|---|---|---|---|---|
| 2024 | $5,681 | $59,100 | -- | -- |
| 2023 | $5,743 | $67,470 | $2,550 | $64,920 |
| 2022 | $2,957 | $30,230 | $2,650 | $27,580 |
| 2021 | $2,968 | $30,230 | $2,650 | $27,580 |
| 2020 | $1,279 | $30,230 | $2,650 | $27,580 |
| 2019 | $1,279 | $12,848 | $2,869 | $9,979 |
| 2018 | $1,146 | $12,848 | $2,869 | $9,979 |
| 2017 | $1,158 | $12,848 | $2,869 | $9,979 |
| 2016 | $1,241 | $13,792 | $2,869 | $10,923 |
| 2015 | $1,236 | $13,792 | $2,869 | $10,923 |
| 2014 | $683 | $15,209 | $2,869 | $12,340 |
Source: Public Records
Map
Nearby Homes
- 439 Dry Creek Rd
- 2531 E 4th St
- 439 Amarillo Ave
- 514 Dry Creek Rd
- 501 Amarillo Ave
- 509 Amarillo Ave
- TBD Merritt Ct
- TBD Merritt Ct Unit 3-4
- 2504 E 6th St
- 2514 E 6th St
- 2526 E 6th St
- 2327 E 4th St
- 511 Amarillo Ave
- 0 Merritt Ct Unit 4 90478
- 0 Merritt Ct Unit 3
- 2509 E 6th St
- 2501 E 6th St
- 2513 E 6th St
- 2519 E 6th St
- 2525 E 6th St
Your Personal Tour Guide
Ask me questions while you tour the home.