Estimated Value: $455,000 - $471,000
4
Beds
2
Baths
2,832
Sq Ft
$164/Sq Ft
Est. Value
About This Home
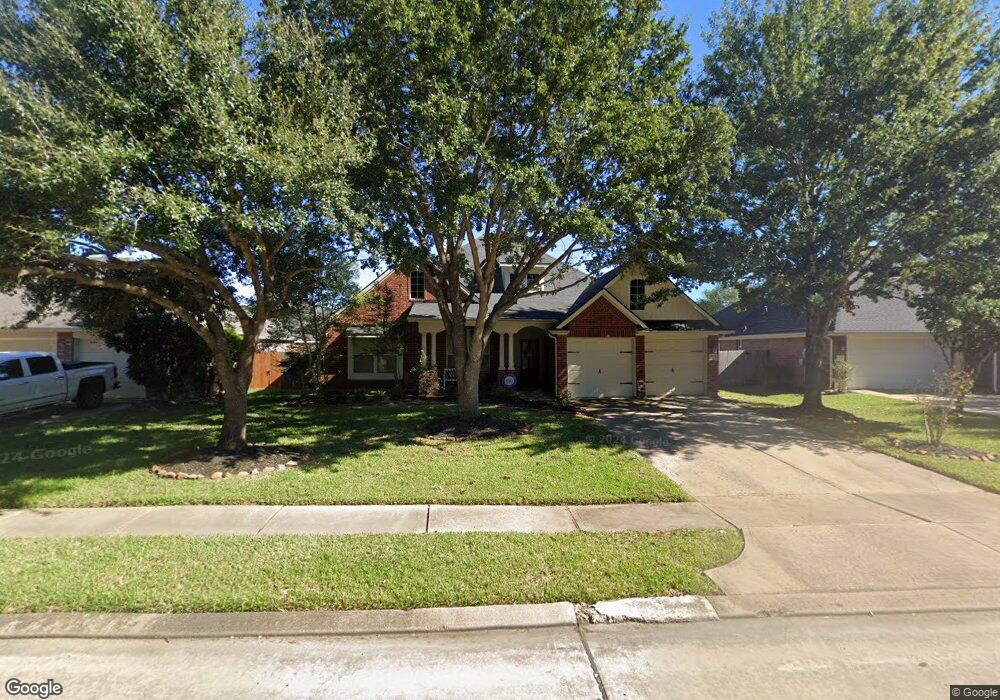
This home is located at 2511 Firecrest Dr, Katy, TX 77494 and is currently estimated at $464,633, approximately $164 per square foot. 2511 Firecrest Dr is a home located in Fort Bend County with nearby schools including Ray And Jamie Wolman Elementary School, Woodcreek Junior High School, and Katy High School.
Ownership History
Date
Name
Owned For
Owner Type
Purchase Details
Closed on
Mar 30, 2015
Sold by
Louvier Michael A and Louvier Catherine L
Bought by
Holden Brian R and Holden Melissa G
Current Estimated Value
Home Financials for this Owner
Home Financials are based on the most recent Mortgage that was taken out on this home.
Original Mortgage
$249,600
Outstanding Balance
$188,148
Interest Rate
3.73%
Mortgage Type
New Conventional
Estimated Equity
$276,485
Purchase Details
Closed on
Nov 29, 2006
Sold by
Mhi Partnership Ltd
Bought by
Louvier Michael A and Louvier Catherine L
Home Financials for this Owner
Home Financials are based on the most recent Mortgage that was taken out on this home.
Original Mortgage
$45,300
Interest Rate
6.3%
Mortgage Type
Stand Alone Second
Purchase Details
Closed on
Dec 15, 2005
Sold by
Jdc / Firethorne Ltd
Bought by
Holden Brian R and Holden Melissa
Create a Home Valuation Report for This Property
The Home Valuation Report is an in-depth analysis detailing your home's value as well as a comparison with similar homes in the area
Home Values in the Area
Average Home Value in this Area
Purchase History
| Date | Buyer | Sale Price | Title Company |
|---|---|---|---|
| Holden Brian R | -- | None Available | |
| Louvier Michael A | -- | Millennium Title Houston | |
| Holden Brian R | -- | -- | |
| Holden Brian R | -- | -- |
Source: Public Records
Mortgage History
| Date | Status | Borrower | Loan Amount |
|---|---|---|---|
| Open | Holden Brian R | $249,600 | |
| Previous Owner | Holden Brian R | $45,300 | |
| Previous Owner | Holden Brian R | $181,350 |
Source: Public Records
Tax History
| Year | Tax Paid | Tax Assessment Tax Assessment Total Assessment is a certain percentage of the fair market value that is determined by local assessors to be the total taxable value of land and additions on the property. | Land | Improvement |
|---|---|---|---|---|
| 2025 | $8,454 | $455,217 | $67,600 | $387,617 |
| 2024 | $8,454 | $428,304 | $26,341 | $401,963 |
| 2023 | $7,799 | $389,367 | $0 | $391,000 |
| 2022 | $8,383 | $353,970 | $0 | $380,490 |
| 2021 | $8,671 | $321,790 | $52,000 | $269,790 |
| 2020 | $8,540 | $312,580 | $52,000 | $260,580 |
| 2019 | $9,082 | $309,900 | $50,000 | $259,900 |
| 2018 | $9,063 | $306,640 | $50,000 | $256,640 |
| 2017 | $9,145 | $305,790 | $50,000 | $255,790 |
| 2016 | $9,581 | $320,380 | $50,000 | $270,380 |
| 2015 | $5,382 | $302,360 | $50,000 | $252,360 |
| 2014 | $5,055 | $274,870 | $50,000 | $224,870 |
Source: Public Records
Map
Nearby Homes
- 28119 Rusty Hawthorne Dr
- 2507 Wind Hawk Ct
- 2519 Llano Springs Dr
- 28203 Fantail Dr
- 28006 Rusty Hawthorne Dr
- 28130 Canyon Wren Dr
- 28011 Canyon Wren Dr
- 28223 Daystrom Ln
- 28215 Gadwall Dr
- 28219 Longspur Dr
- 28003 Longspur Dr
- 27907 Warren Park Dr
- 2835 Chalet Knolls Ln
- 2402 Chesley Park Ct
- 2827 Fair Chase Dr
- 28243 Stonestead Dr
- 28255 Stonestead Dr
- 28115 Chalet Park Dr
- 27931 Walsh Crossing Dr
- 2919 Chalet Knolls Ln
- 2515 Firecrest Dr
- 2507 Firecrest Dr
- 2503 Wind Hawk Ct
- 2506 Wind Hawk Ct
- 2510 Firecrest Dr
- 2514 Firecrest Dr
- 28115 Rusty Hawthorne Dr
- 2523 Firecrest Dr
- 2506 Firecrest Dr
- 2518 Firecrest Dr
- 28122 Rusty Hawthorne Dr
- 2522 Firecrest Dr
- 28118 Rusty Hawthorne Dr
- 28126 Rusty Hawthorne Dr
- 28111 Rusty Hawthorne Dr
- 2502 Firecrest Dr
- 2510 Wind Hawk Ct
- 2527 Firecrest Dr
- 28114 Rusty Hawthorne Dr
- 2526 Firecrest Dr
Your Personal Tour Guide
Ask me questions while you tour the home.