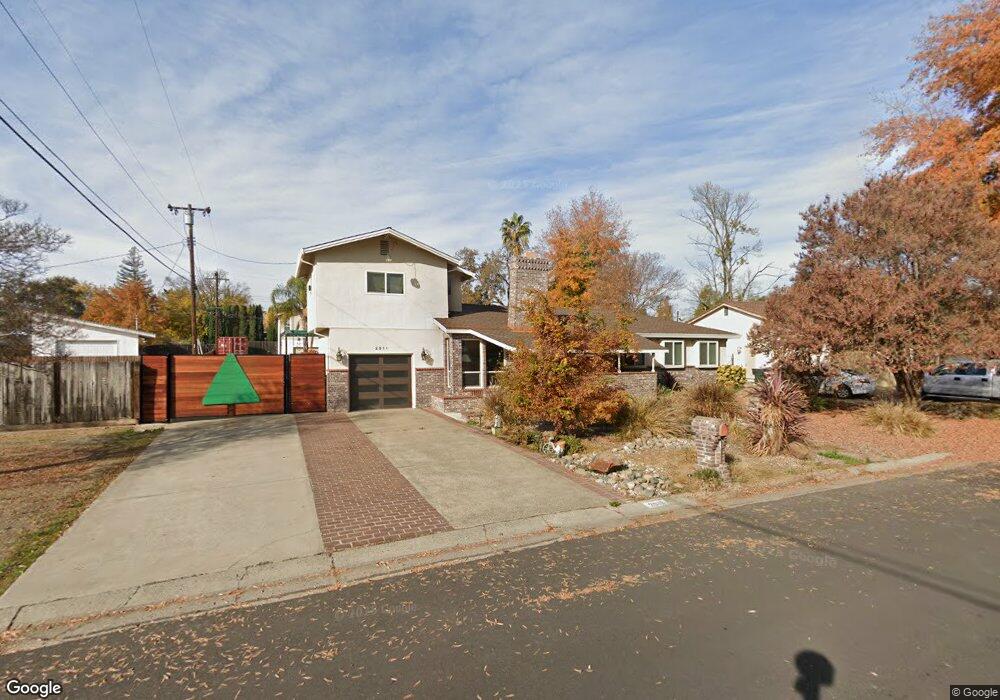
2511 Laurence Ave Carmichael, CA 95608
Greenwood NeighborhoodEstimated Value: $547,000 - $598,000
3
Beds
2
Baths
2,326
Sq Ft
$247/Sq Ft
Est. Value
About This Home
This home is located at 2511 Laurence Ave, Carmichael, CA 95608 and is currently estimated at $575,261, approximately $247 per square foot. 2511 Laurence Ave is a home located in Sacramento County with nearby schools including Starr King K-8, Rio Americano High School, and Visions In Education School.
Ownership History
Date
Name
Owned For
Owner Type
Purchase Details
Closed on
Feb 23, 2019
Sold by
Astle Roy S and Astle Debra L
Bought by
Astle Roy Stanley and Astle Debra
Current Estimated Value
Purchase Details
Closed on
May 31, 2005
Sold by
Astle Roy S and Astle Debra L
Bought by
Astle Roy S and Astle Debra L
Home Financials for this Owner
Home Financials are based on the most recent Mortgage that was taken out on this home.
Original Mortgage
$432,000
Outstanding Balance
$225,240
Interest Rate
5.74%
Mortgage Type
New Conventional
Estimated Equity
$350,022
Purchase Details
Closed on
Jun 30, 1999
Sold by
Scott George K and Scott Kenneth G
Bought by
Astle Roy S and Astle Debra L
Home Financials for this Owner
Home Financials are based on the most recent Mortgage that was taken out on this home.
Original Mortgage
$88,200
Interest Rate
7.24%
Mortgage Type
Seller Take Back
Create a Home Valuation Report for This Property
The Home Valuation Report is an in-depth analysis detailing your home's value as well as a comparison with similar homes in the area
Home Values in the Area
Average Home Value in this Area
Purchase History
| Date | Buyer | Sale Price | Title Company |
|---|---|---|---|
| Astle Roy Stanley | -- | None Available | |
| Astle Roy S | -- | Chicago Title Co | |
| Astle Roy S | $110,500 | Sacramento Title Company |
Source: Public Records
Mortgage History
| Date | Status | Borrower | Loan Amount |
|---|---|---|---|
| Open | Astle Roy S | $432,000 | |
| Closed | Astle Roy S | $88,200 |
Source: Public Records
Tax History
| Year | Tax Paid | Tax Assessment Tax Assessment Total Assessment is a certain percentage of the fair market value that is determined by local assessors to be the total taxable value of land and additions on the property. | Land | Improvement |
|---|---|---|---|---|
| 2025 | $2,069 | $177,023 | $17,435 | $159,588 |
| 2024 | $2,069 | $173,553 | $17,094 | $156,459 |
| 2023 | $2,016 | $170,151 | $16,759 | $153,392 |
| 2022 | $2,003 | $166,816 | $16,431 | $150,385 |
| 2021 | $1,969 | $163,546 | $16,109 | $147,437 |
| 2020 | $1,932 | $161,870 | $15,944 | $145,926 |
| 2019 | $1,977 | $158,697 | $15,632 | $143,065 |
| 2018 | $1,947 | $155,586 | $15,326 | $140,260 |
| 2017 | $1,936 | $152,536 | $15,026 | $137,510 |
| 2016 | $1,811 | $149,546 | $14,732 | $134,814 |
| 2015 | $1,780 | $147,300 | $14,511 | $132,789 |
| 2014 | $1,742 | $144,415 | $14,227 | $130,188 |
Source: Public Records
Map
Nearby Homes
- 2611 Foothill Dr
- 2334 Via Camino Ave
- 5132 El Camino Ave Unit 108
- 5132 El Camino Ave Unit 202
- 5001 Boyd Dr
- 4623 Hazelwood Ave
- 4829 Saint Lynn Ln
- 5140 Whisper Oaks Ln
- 5216 Wyndham Oak Ln
- 4609 Nottingham Cir
- 4837 Donnie Lyn Way
- 2628 Greenwood Ave
- 2432 Camino Garden Way
- 4838 Robertson Ave
- 3041 Root Ave
- 4720 Robertson Ave
- 2032 Mission Ave
- 2855 La Colina Way
- 2117 Venus Dr
- 4951 Kurz Cir
- 2521 Laurence Ave
- 4901 El Camino Ave
- 4849 Hazelwood Ave
- 4853 Hazelwood Ave
- 2531 Laurence Ave
- 2510 Laurence Ave
- 4851 Hazelwood Ave
- 2500 Laurence Ave
- 4841 Hazelwood Ave
- 2530 Laurence Ave
- 2541 Laurence Ave
- 4837 Hazelwood Ave
- 4919 El Camino Ave
- 4852 Hazelwood Ave
- 4848 Hazelwood Ave
- 4856 Hazelwood Ave
- 2550 Laurence Ave
- 4833 El Camino Ave
- 4844 Hazelwood Ave
Your Personal Tour Guide
Ask me questions while you tour the home.