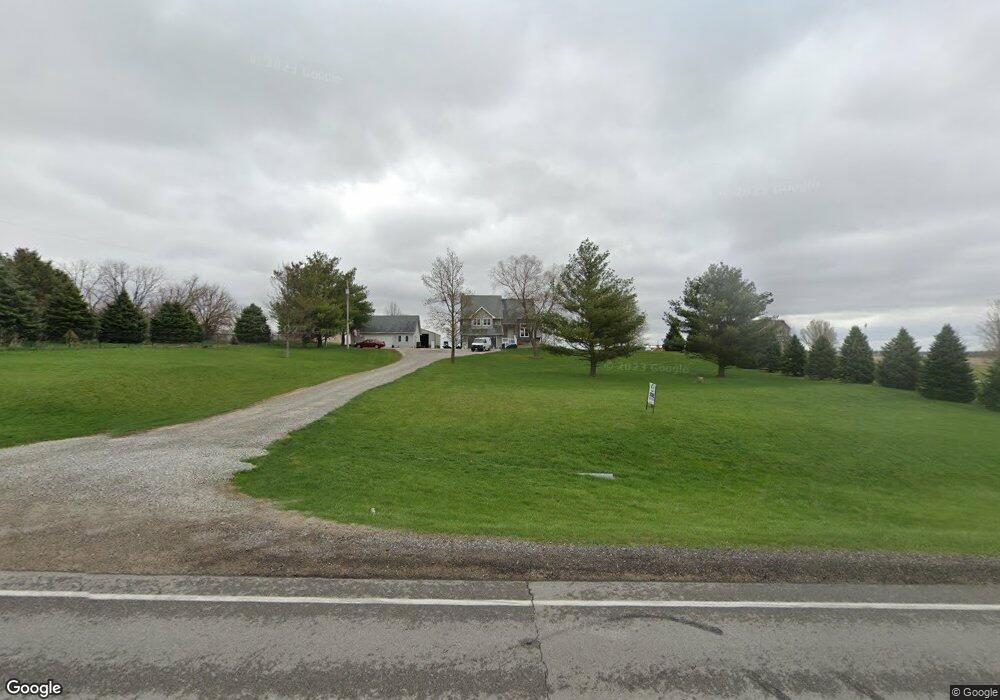
2511 SE 116th St Runnells, IA 50237
Estimated Value: $418,000 - $617,749
3
Beds
3
Baths
2,407
Sq Ft
$220/Sq Ft
Est. Value
About This Home
This home is located at 2511 SE 116th St, Runnells, IA 50237 and is currently estimated at $530,437, approximately $220 per square foot. 2511 SE 116th St is a home located in Polk County with nearby schools including Runnells Elementary School, Southeast Polk Spring Creek- 6th Grade, and Southeast Polk Junior High School.
Ownership History
Date
Name
Owned For
Owner Type
Purchase Details
Closed on
Jan 28, 2025
Sold by
Meeker Brian A and Meeker Laura R
Bought by
Meeker Family Trust and Meeker
Current Estimated Value
Purchase Details
Closed on
Nov 15, 2005
Sold by
Kelly Francis J and Kelly Debra S
Bought by
Meeker Brian A and Meeker Laura R
Home Financials for this Owner
Home Financials are based on the most recent Mortgage that was taken out on this home.
Original Mortgage
$242,000
Interest Rate
5.87%
Mortgage Type
Fannie Mae Freddie Mac
Purchase Details
Closed on
Jul 14, 1999
Sold by
Landsverk Ivan and Landsverk Bonnie
Bought by
Kelly Francis J and Kelly Debra S
Home Financials for this Owner
Home Financials are based on the most recent Mortgage that was taken out on this home.
Original Mortgage
$146,000
Interest Rate
7.43%
Create a Home Valuation Report for This Property
The Home Valuation Report is an in-depth analysis detailing your home's value as well as a comparison with similar homes in the area
Home Values in the Area
Average Home Value in this Area
Purchase History
| Date | Buyer | Sale Price | Title Company |
|---|---|---|---|
| Meeker Family Trust | -- | None Listed On Document | |
| Meeker Brian A | $302,000 | -- | |
| Kelly Francis J | $182,000 | -- |
Source: Public Records
Mortgage History
| Date | Status | Borrower | Loan Amount |
|---|---|---|---|
| Previous Owner | Meeker Brian A | $242,000 | |
| Previous Owner | Kelly Francis J | $146,000 |
Source: Public Records
Tax History Compared to Growth
Tax History
| Year | Tax Paid | Tax Assessment Tax Assessment Total Assessment is a certain percentage of the fair market value that is determined by local assessors to be the total taxable value of land and additions on the property. | Land | Improvement |
|---|---|---|---|---|
| 2025 | $7,096 | $597,700 | $107,900 | $489,800 |
| 2024 | $7,096 | $536,300 | $95,000 | $441,300 |
| 2023 | $6,702 | $495,200 | $95,000 | $400,200 |
| 2022 | $6,614 | $393,700 | $78,900 | $314,800 |
| 2021 | $6,250 | $393,700 | $78,900 | $314,800 |
| 2020 | $6,160 | $353,600 | $70,300 | $283,300 |
| 2019 | $5,790 | $353,600 | $70,300 | $283,300 |
| 2018 | $5,818 | $319,500 | $62,100 | $257,400 |
| 2017 | $6,256 | $319,500 | $62,100 | $257,400 |
| 2016 | $6,248 | $308,000 | $55,300 | $252,700 |
| 2015 | $6,248 | $308,000 | $55,300 | $252,700 |
| 2014 | $6,064 | $293,200 | $51,600 | $241,600 |
Source: Public Records
Map
Nearby Homes
- 10641 SE 6th Ave
- 12028 SE 64th Ave
- 3380 SE 96th St
- 3320 SE 96th St
- 502 Brown St
- 1200 SE 92nd St
- 203 Brown St
- 1125 NE 91st St
- 2496 SE 83rd Ct
- 2511 SE 82nd St
- 3356 SE 82nd St
- 3350 SE 82nd St
- 7930 SE Vandalia Dr
- 7820 SE Vandalia Dr
- 5766 Arbor Springs Dr
- 5736 Arbor Hills Ct
- 5792 Arbor Hills Ct
- 22955 Buchanan Trail
- 13565 S 60th Ave W
- 7740 Spring Creek Dr
- 2591 SE 116th St
- 2469 SE 116th St
- 2353 SE 116th St
- 2264 SE 116th St
- 2240 SE 116th St
- 2137 SE 116th St
- 2887 SE 116th St
- 2150 SE 116th St
- 2945 SE 116th St
- 2198 SE 116th St
- 11471 SE Miller Dr
- 12260 SE Miller Dr
- 0 SE Miller Dr
- 11696 SE Miller Dr
- 11835 SE Miller Dr
- 11510 Millers Rd
- 11433 SE Miller Dr
- 11834 SE Miller Dr
- 1850 SE Camp Dr
- 11428 SE Miller Dr